Bank of America 2014 Annual Report Download - page 114
Download and view the complete annual report
Please find page 114 of the 2014 Bank of America annual report below. You can navigate through the pages in the report by either clicking on the pages listed below, or by using the keyword search tool below to find specific information within the annual report.-
 1
1 -
2
-
3
-
4
-
5
-
6
-
7
-
8
-
9
-
10
-
11
-
12
-
13
-
14
-
15
-
16
-
17
-
18
-
19
-
20
-
21
-
22
-
23
-
24
-
25
-
26
-
27
-
28
-
29
-
30
-
31
-
32
-
33
-
34
-
35
-
36
-
37
-
38
-
39
-
40
-
41
-
42
-
43
-
44
-
45
-
46
-
47
-
48
-
49
-
50
-
51
-
52
-
53
-
54
-
55
-
56
-
57
-
58
-
59
-
60
-
61
-
62
-
63
-
64
-
65
-
66
-
67
-
68
-
69
-
70
-
71
-
72
-
73
-
74
-
75
-
76
-
77
-
78
-
79
-
80
-
81
-
82
-
83
-
84
-
85
-
86
-
87
-
88
-
89
-
90
-
91
-
92
-
93
-
94
-
95
-
96
-
97
-
98
-
99
-
100
-
101
-
102
-
103
-
 104
104 -
 105
105 -
 106
106 -
 107
107 -
 108
108 -
 109
109 -
 110
110 -
 111
111 -
 112
112 -
 113
113 -
 114
114 -
 115
115 -
 116
116 -
 117
117 -
 118
118 -
 119
119 -
 120
120 -
 121
121 -
 122
122 -
 123
123 -
 124
124 -
125
-
126
-
127
-
128
-
129
-
130
-
131
-
132
-
133
-
134
-
135
-
136
-
137
-
138
-
139
-
140
-
141
-
142
-
143
-
144
-
145
-
146
-
147
-
148
-
149
-
150
-
151
-
152
-
153
-
154
-
155
-
156
-
157
-
158
-
159
-
160
-
161
-
162
-
163
-
164
-
165
-
166
-
167
-
168
-
169
-
170
-
171
-
172
-
173
-
174
-
175
-
176
-
177
-
178
-
179
-
180
-
181
-
182
-
183
-
184
-
185
-
186
-
187
-
188
-
189
-
190
-
191
-
192
-
193
-
194
-
195
-
196
-
197
-
198
-
199
-
200
-
201
-
202
-
203
-
204
-
205
-
206
-
207
-
208
-
209
-
210
-
211
-
212
-
213
-
214
-
215
-
216
-
217
-
218
-
219
-
220
-
221
-
222
-
223
-
224
-
225
-
226
-
227
-
228
-
229
-
230
-
231
-
232
-
233
-
234
-
235
-
236
-
237
-
238
-
239
-
240
-
241
-
242
-
243
-
244
-
245
-
246
-
247
-
248
-
249
-
250
-
251
-
252
-
253
-
254
-
255
-
256
-
257
-
258
-
259
-
260
-
261
-
262
-
263
-
264
-
265
-
266
-
267
-
268
-
269
-
270
-
271
-
272
 |
 |

112 Bank of America 2014
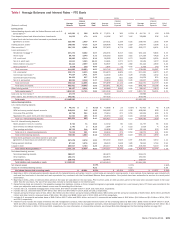
Noninterest Income
Noninterest income was $46.7 billion in 2013, an increase of $4.0
billion compared to 2012.
Card income decreased $295 million primarily driven by lower
revenue from consumer protection products.
Investment and brokerage services income increased $889
million primarily driven by the impact of long-term AUM inflows
and higher market levels.
Investment banking income increased $827 million primarily
due to strong equity issuance fees attributable to a significant
increase in global equity capital markets volume and higher debt
issuance fees, primarily within leveraged finance and
investment-grade underwriting.
Equity investment income increased $831 million. The results
for 2013 included $753 million of gains related to the sale of
our remaining investment in CCB and gains of $1.4 billion on
the sales of a portion of an equity investment. The results for
2012 included $1.6 billion of gains related to sales of certain
equity and strategic investments.
Trading account profits increased $1.2 billion. Net debit
valuation adjustment (DVA) losses on derivatives were $509
million in 2013 compared to losses of $2.5 billion in 2012.
Excluding net DVA, trading account profits decreased $782
million due to decreases in our FICC businesses driven by a
challenging trading environment, partially offset by an increase
in our equities businesses.
Mortgage banking income decreased $876 million primarily
driven by lower servicing income and lower core production
revenue, partially offset by lower representations and warranties
provision.
Other income (loss) improved $2.0 billion due to lower negative
fair value adjustments on our structured liabilities of $649
million compared to negative fair value adjustments of $5.1
billion in 2012. The prior year included gains of $1.6 billion
related to debt repurchases and exchanges of trust preferred
securities.
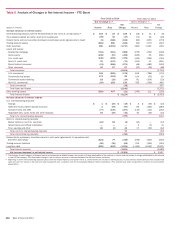
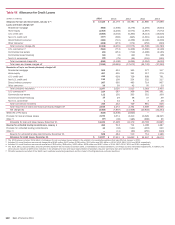
Provision for Credit Losses
The provision for credit losses was $3.6 billion for 2013, a
decrease of $4.6 billion compared to 2012. The provision for credit
losses was $4.3 billion lower than net charge-offs for 2013,
resulting in a reduction in the allowance for credit losses due to
continued improvement in the home loans and credit card
portfolios. This compared to a $6.7 billion reduction in the
allowance for credit losses in 2012.
Net charge-offs totaled $7.9 billion, or 0.87 percent of average
loans and leases for 2013 compared to $14.9 billion, or 1.67
percent for 2012. The decrease in net charge-offs was primarily
driven by credit quality improvement across all major portfolios.
Also, included in 2012 were charge-offs associated with the
National Mortgage Settlement and loans discharged in Chapter 7
bankruptcy due to the implementation of regulatory guidance.
Noninterest Expense
Noninterest expense was $69.2 billion for 2013, a decrease of
$2.9 billion compared to 2012. The decrease was primarily driven
by a $967 million decline in other general operating expense largely
due to a provision of $1.1 billion in 2012 for the 2013 Independent
Foreclosure Review (IFR) Acceleration Agreement, lower FDIC
expense, and lower default-related servicing expenses in Legacy
Assets & Servicing and mortgage-related assessments, waivers
and similar costs related to foreclosure delays. Partially offsetting
these declines was a $1.9 billion increase in litigation expense to
$6.1 billion in 2013. Personnel expense decreased $929 million
in 2013 as we continued to streamline processes and achieve
cost savings. Professional fees decreased $690 million due in
part to reduced default-related management activities in Legacy
Assets & Servicing.
Income Tax Expense
The income tax expense was $4.7 billion on pretax income of
$16.2 billion for 2013 compared to an income tax benefit of $1.1
billion on the pretax income of $3.1 billion for 2012. The effective
tax rate for 2013 was driven by our recurring tax preference items
and by tax benefits related to non-U.S. restructurings. These
benefits were partially offset by the $1.1 billion charge to reduce
the carrying value of certain U.K deferred tax assets due to the
U.K corporate income tax rate reduction in 2013. The negative
effective tax rate for 2012 included a $1.7 billion tax benefit
attributable to the excess of foreign tax credits recognized in the
U.S. upon repatriation of the earnings of certain subsidiaries over
the related U.S. tax liability. Partially offsetting the benefit was a
$788 million charge to reduce the carrying value of certain U.K.
deferred tax assets due to the U.K. corporate income tax rate
reduction enacted in 2012.
Business Segment Operations
Consumer & Business Banking
CBB recorded net income of $6.6 billion in 2013 compared to
$5.6 billion in 2012 with the increase primarily due to lower
provision for credit losses and noninterest expense. Net interest
income remained relatively unchanged as the impact of higher
deposit balances was offset by the impact of lower average loan
balances. Noninterest income of $9.8 billion remained relatively
unchanged as the allocation of certain card revenue to GWIM for
clients with a credit card, and lower deposit service charges were
offset by the net impact of consumer protection products primarily
due to changes in 2012. The provision for credit losses decreased
$1.0 billion to $3.1 billion in 2013 primarily as a result of
improvements in credit quality. Noninterest expense decreased
$661 million to $16.3 billion primarily due to lower operating,
personnel and FDIC expenses.