Bank of America 2014 Annual Report Download - page 184
Download and view the complete annual report
Please find page 184 of the 2014 Bank of America annual report below. You can navigate through the pages in the report by either clicking on the pages listed below, or by using the keyword search tool below to find specific information within the annual report.-
 1
1 -
2
-
3
-
4
-
5
-
6
-
7
-
8
-
9
-
10
-
11
-
12
-
13
-
14
-
15
-
16
-
17
-
18
-
19
-
20
-
21
-
22
-
23
-
24
-
25
-
26
-
27
-
28
-
29
-
30
-
31
-
32
-
33
-
34
-
35
-
36
-
37
-
38
-
39
-
40
-
41
-
42
-
43
-
44
-
45
-
46
-
47
-
48
-
49
-
50
-
51
-
52
-
53
-
54
-
55
-
56
-
57
-
58
-
59
-
60
-
61
-
62
-
63
-
64
-
65
-
66
-
67
-
68
-
69
-
70
-
71
-
72
-
73
-
74
-
75
-
76
-
77
-
78
-
79
-
80
-
81
-
82
-
83
-
84
-
85
-
86
-
87
-
88
-
89
-
90
-
91
-
92
-
93
-
94
-
95
-
96
-
97
-
98
-
99
-
100
-
101
-
102
-
103
-
104
-
105
-
106
-
107
-
108
-
109
-
110
-
111
-
112
-
113
-
114
-
115
-
116
-
117
-
118
-
119
-
120
-
121
-
122
-
123
-
124
-
125
-
126
-
127
-
128
-
129
-
130
-
131
-
132
-
133
-
134
-
135
-
136
-
137
-
138
-
139
-
140
-
141
-
142
-
143
-
144
-
145
-
146
-
147
-
148
-
149
-
150
-
151
-
152
-
153
-
154
-
155
-
156
-
157
-
158
-
159
-
160
-
161
-
162
-
163
-
164
-
165
-
166
-
167
-
168
-
169
-
170
-
171
-
172
-
173
-
 174
174 -
 175
175 -
 176
176 -
 177
177 -
 178
178 -
 179
179 -
 180
180 -
 181
181 -
 182
182 -
 183
183 -
 184
184 -
 185
185 -
 186
186 -
 187
187 -
 188
188 -
 189
189 -
 190
190 -
 191
191 -
 192
192 -
 193
193 -
 194
194 -
195
-
196
-
197
-
198
-
199
-
200
-
201
-
202
-
203
-
204
-
205
-
206
-
207
-
208
-
209
-
210
-
211
-
212
-
213
-
214
-
215
-
216
-
217
-
218
-
219
-
220
-
221
-
222
-
223
-
224
-
225
-
226
-
227
-
228
-
229
-
230
-
231
-
232
-
233
-
234
-
235
-
236
-
237
-
238
-
239
-
240
-
241
-
242
-
243
-
244
-
245
-
246
-
247
-
248
-
249
-
250
-
251
-
252
-
253
-
254
-
255
-
256
-
257
-
258
-
259
-
260
-
261
-
262
-
263
-
264
-
265
-
266
-
267
-
268
-
269
-
270
-
271
-
272
 |
 |

182 Bank of America 2014
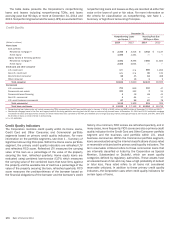
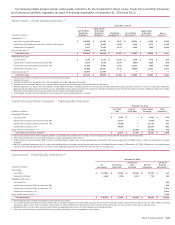
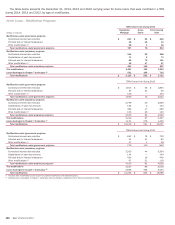
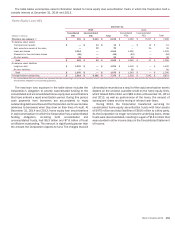
The table below provides the unpaid principal balance, carrying value and related allowance at December 31, 2014 and 2013, and
the average carrying value and interest income recognized for 2014, 2013 and 2012 on the Corporation’s renegotiated TDR portfolio
in the Credit Card and Other Consumer portfolio segment.
Impaired Loans – Credit Card and Other Consumer – Renegotiated TDRs
December 31, 2014 December 31, 2013
(Dollars in millions)
Unpaid
Principal
Balance
Carrying
Value (1)
Related
Allowance
Unpaid
Principal
Balance
Carrying
Value (1)
Related
Allowance
With no recorded allowance
Direct/Indirect consumer $59$25$ —
$75$32$ —
Other consumer ———
34 34 —
With an allowance recorded
U.S. credit card $ 804 $ 856 $207 $ 1,384 $ 1,465 $ 337
Non-U.S. credit card 132 168 108 200 240 149
Direct/Indirect consumer 76 92 24 242 282 84
Other consumer ———
27 26 9
Total
U.S. credit card $ 804 $ 856 $207 $ 1,384 $ 1,465 $ 337
Non-U.S. credit card 132 168 108 200 240 149
Direct/Indirect consumer 135 117 24 317 314 84
Other consumer — — — 61 60 9
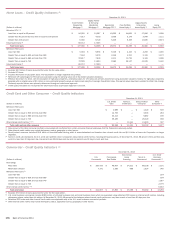
2014 2013 2012
Average
Carrying
Value
Interest
Income
Recognized (2)
Average
Carrying
Value
Interest
Income
Recognized (2)
Average
Carrying
Value
Interest
Income
Recognized (2)
With no recorded allowance
Direct/Indirect consumer $27$ —
$42$ —$58$ —
Other consumer 33 2 34 2 35 2
With an allowance recorded
U.S. credit card $ 1,148 $ 71 $ 2,144 $ 134 $ 4,085 $ 253
Non-U.S. credit card 210 6 266 7 464 10
Direct/Indirect consumer 180 9 456 24 929 50
Other consumer 23 1 28 2 29 2
Total
U.S. credit card $ 1,148 $ 71 $ 2,144 $ 134 $ 4,085 $ 253
Non-U.S. credit card 210 6 266 7 464 10
Direct/Indirect consumer 207 9 498 24 987 50
Other consumer 56 3 62 4 64 4
(1) Includes accrued interest and fees.
(2) Interest income recognized includes interest accrued and collected on the outstanding balances of accruing impaired loans as well as interest cash collections on nonaccruing impaired loans for
which the principal is considered collectible.
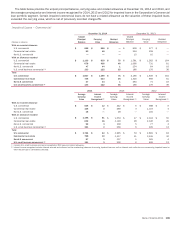
The table below provides information on the Corporation’s primary modification programs for the renegotiated TDR portfolio at
December 31, 2014 and 2013.
Credit Card and Other Consumer – Renegotiated TDRs by Program Type
December 31
Internal Programs External Programs Other (1) Total
Percent of Balances Current or
Less Than 30 Days Past Due
(Dollars in millions) 2014 2013 2014 2013 2014 2013 2014 2013 2014 2013
U.S. credit card $ 450 $ 842 $ 397 $ 607 $9
$16
$856 $ 1,465 84.99% 82.77%
Non-U.S. credit card 41 71 16 26 111 143 168 240 47.56 49.01
Direct/Indirect consumer 50 170 34 106 33 38 117 314 85.21 84.29
Other consumer —60 —————60 —71.08
Total renegotiated TDRs $ 541 $ 1,143 $ 447 $ 739 $153 $ 197 $ 1,141 $ 2,079 79.51 78.77
(1) Other TDRs for non-U.S. credit card include modifications of accounts that are ineligible for a fixed payment plan.