Bank of America 2014 Annual Report Download - page 94
Download and view the complete annual report
Please find page 94 of the 2014 Bank of America annual report below. You can navigate through the pages in the report by either clicking on the pages listed below, or by using the keyword search tool below to find specific information within the annual report.-
 1
1 -
2
-
3
-
4
-
5
-
6
-
7
-
8
-
9
-
10
-
11
-
12
-
13
-
14
-
15
-
16
-
17
-
18
-
19
-
20
-
21
-
22
-
23
-
24
-
25
-
26
-
27
-
28
-
29
-
30
-
31
-
32
-
33
-
34
-
35
-
36
-
37
-
38
-
39
-
40
-
41
-
42
-
43
-
44
-
45
-
46
-
47
-
48
-
49
-
50
-
51
-
52
-
53
-
54
-
55
-
56
-
57
-
58
-
59
-
60
-
61
-
62
-
63
-
64
-
65
-
66
-
67
-
68
-
69
-
70
-
71
-
72
-
73
-
74
-
75
-
76
-
77
-
78
-
79
-
80
-
81
-
82
-
83
-
 84
84 -
 85
85 -
 86
86 -
 87
87 -
 88
88 -
 89
89 -
 90
90 -
 91
91 -
 92
92 -
 93
93 -
 94
94 -
 95
95 -
 96
96 -
 97
97 -
 98
98 -
 99
99 -
 100
100 -
 101
101 -
 102
102 -
 103
103 -
 104
104 -
105
-
106
-
107
-
108
-
109
-
110
-
111
-
112
-
113
-
114
-
115
-
116
-
117
-
118
-
119
-
120
-
121
-
122
-
123
-
124
-
125
-
126
-
127
-
128
-
129
-
130
-
131
-
132
-
133
-
134
-
135
-
136
-
137
-
138
-
139
-
140
-
141
-
142
-
143
-
144
-
145
-
146
-
147
-
148
-
149
-
150
-
151
-
152
-
153
-
154
-
155
-
156
-
157
-
158
-
159
-
160
-
161
-
162
-
163
-
164
-
165
-
166
-
167
-
168
-
169
-
170
-
171
-
172
-
173
-
174
-
175
-
176
-
177
-
178
-
179
-
180
-
181
-
182
-
183
-
184
-
185
-
186
-
187
-
188
-
189
-
190
-
191
-
192
-
193
-
194
-
195
-
196
-
197
-
198
-
199
-
200
-
201
-
202
-
203
-
204
-
205
-
206
-
207
-
208
-
209
-
210
-
211
-
212
-
213
-
214
-
215
-
216
-
217
-
218
-
219
-
220
-
221
-
222
-
223
-
224
-
225
-
226
-
227
-
228
-
229
-
230
-
231
-
232
-
233
-
234
-
235
-
236
-
237
-
238
-
239
-
240
-
241
-
242
-
243
-
244
-
245
-
246
-
247
-
248
-
249
-
250
-
251
-
252
-
253
-
254
-
255
-
256
-
257
-
258
-
259
-
260
-
261
-
262
-
263
-
264
-
265
-
266
-
267
-
268
-
269
-
270
-
271
-
272
 |
 |

92 Bank of America 2014
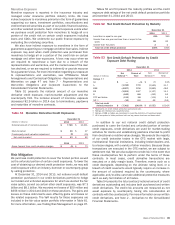
in these countries. Net exposure at December 31, 2014 to Italy
and Spain was $5.4 billion and $3.6 billion as presented in Table
57. For the remaining three countries noted above, net exposure
at December 31, 2014 was $2.1 billion which primarily relates to
Ireland. We expect to continue to support client activities in the
region and our exposures may vary over time as we monitor the
situation and manage our risk profile.
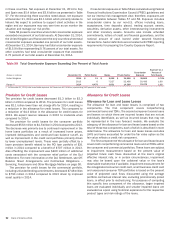
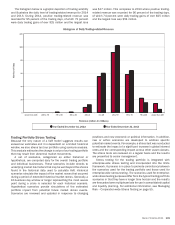
Table 58 presents countries where total cross-border exposure
exceeded one percent of our total assets. At December 31, 2014,
the United Kingdom and France were the only countries where total
cross-border exposure exceeded one percent of our total assets.
At December 31, 2014, Germany had total cross-border exposure
of $15.9 billion representing 0.76 percent of our total assets. No
other countries had total cross-border exposure that exceeded
0.75 percent of our total assets at December 31, 2014.
Cross-border exposures in Table 58 are calculated using Federal
Financial Institutions Examination Council (FFIEC) guidelines and
not our internal risk management view; therefore, exposures are
not comparable between Tables 57 and 58. Exposure includes
cross-border claims by our non-U.S. offices including loans,
acceptances, time deposits placed, trading account assets,
securities, derivative assets, other interest-earning investments
and other monetary assets. Amounts also include unfunded
commitments, letters of credit and financial guarantees, and the
notional amount of cash loaned under secured financing
transactions. Sector definitions are consistent with FFIEC reporting
requirements for preparing the Country Exposure Report.
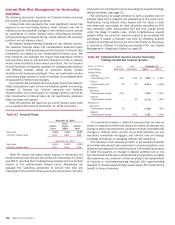
Table 58 Total Cross-border Exposure Exceeding One Percent of Total Assets
(Dollars in millions) December 31 Public Sector Banks Private Sector
Cross-border
Exposure
Exposure as a
Percent of
Total Assets
United Kingdom 2014 $ 11 $ 2,056 $ 34,595 $ 36,662 1.74%
2013 6 7,027 32,466 39,499 1.88
France (1) 2014 4,479 2,631 14,368 21,478 1.02
(1) At December 31, 2013, total cross-border exposure for France was $17.8 billion, representing 0.85 percent of total assets.
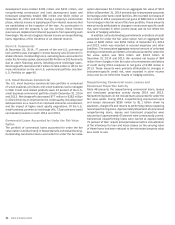
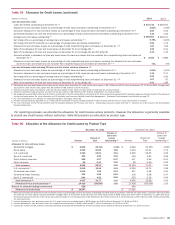
Provision for Credit Losses
The provision for credit losses decreased $1.3 billion to $2.3
billion in 2014 compared to 2013. The provision for credit losses
was $2.1 billion lower than net charge-offs for 2014, resulting in
a reduction in the allowance for credit losses. This compared to
a reduction of $4.3 billion in the allowance for credit losses for
2013. We expect reserve releases in 2015 to moderate when
compared to 2014.
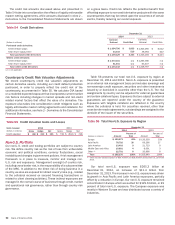
The provision for credit losses for the consumer portfolio
decreased $533 million to $1.5 billion in 2014 compared to 2013.
The decrease was primarily due to continued improvement in the
home loans portfolios as a result of increased home prices,
improved delinquencies and continued loan balance run-off, as
well as improvement in the credit card portfolios primarily driven
by lower unemployment levels. These were partially offset by a
lower provision benefit related to the PCI loan portfolio of $31
million in 2014 compared to a benefit of $707 million in 2013.
Also offsetting the improvement was $400 million of additional
costs associated with the consumer relief portion of the DoJ
Settlement. For more information on the DoJ Settlement, see Off-
Balance Sheet Arrangements and Contractual Obligations –
Servicing, Foreclosure and Other Mortgage Matters on page 50.
The provision for credit losses for the commercial portfolio,
including unfunded lending commitments, decreased $748 million
to $793 million in 2014 compared to 2013 driven by improved
asset quality in 2014.
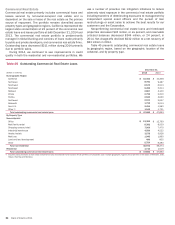
Allowance for Credit Losses
Allowance for Loan and Lease Losses
The allowance for loan and lease losses is comprised of two
components. The first component covers nonperforming
commercial loans and TDRs. The second component covers loans
and leases on which there are incurred losses that are not yet
individually identifiable, as well as incurred losses that may not
be represented in the loss forecast models. We evaluate the
adequacy of the allowance for loan and lease losses based on the
total of these two components, each of which is described in more
detail below. The allowance for loan and lease losses excludes
LHFS and loans accounted for under the fair value option as the
fair value reflects a credit risk component.
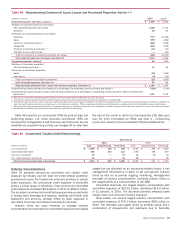
The first component of the allowance for loan and lease losses
covers both nonperforming commercial loans and all TDRs within
the consumer and commercial portfolios. These loans are subject
to impairment measurement based on the present value of
projected future cash flows discounted at the loan’s original
effective interest rate, or in certain circumstances, impairment
may also be based upon the collateral value or the loan’s
observable market price if available. Impairment measurement for
the renegotiated consumer credit card, small business credit card
and unsecured consumer TDR portfolios is based on the present
value of projected cash flows discounted using the average
portfolio contractual interest rate, excluding promotionally priced
loans, in effect prior to restructuring. For purposes of computing
this specific loss component of the allowance, larger impaired
loans are evaluated individually and smaller impaired loans are
evaluated as a pool using historical experience for the respective
product types and risk ratings of the loans.