Bank of America 2014 Annual Report Download - page 72
Download and view the complete annual report
Please find page 72 of the 2014 Bank of America annual report below. You can navigate through the pages in the report by either clicking on the pages listed below, or by using the keyword search tool below to find specific information within the annual report.-
 1
1 -
2
-
3
-
4
-
5
-
6
-
7
-
8
-
9
-
10
-
11
-
12
-
13
-
14
-
15
-
16
-
17
-
18
-
19
-
20
-
21
-
22
-
23
-
24
-
25
-
26
-
27
-
28
-
29
-
30
-
31
-
32
-
33
-
34
-
35
-
36
-
37
-
38
-
39
-
40
-
41
-
42
-
43
-
44
-
45
-
46
-
47
-
48
-
49
-
50
-
51
-
52
-
53
-
54
-
55
-
56
-
57
-
58
-
59
-
60
-
61
-
 62
62 -
 63
63 -
 64
64 -
 65
65 -
 66
66 -
 67
67 -
 68
68 -
 69
69 -
 70
70 -
 71
71 -
 72
72 -
 73
73 -
 74
74 -
 75
75 -
 76
76 -
 77
77 -
 78
78 -
 79
79 -
 80
80 -
 81
81 -
 82
82 -
83
-
84
-
85
-
86
-
87
-
88
-
89
-
90
-
91
-
92
-
93
-
94
-
95
-
96
-
97
-
98
-
99
-
100
-
101
-
102
-
103
-
104
-
105
-
106
-
107
-
108
-
109
-
110
-
111
-
112
-
113
-
114
-
115
-
116
-
117
-
118
-
119
-
120
-
121
-
122
-
123
-
124
-
125
-
126
-
127
-
128
-
129
-
130
-
131
-
132
-
133
-
134
-
135
-
136
-
137
-
138
-
139
-
140
-
141
-
142
-
143
-
144
-
145
-
146
-
147
-
148
-
149
-
150
-
151
-
152
-
153
-
154
-
155
-
156
-
157
-
158
-
159
-
160
-
161
-
162
-
163
-
164
-
165
-
166
-
167
-
168
-
169
-
170
-
171
-
172
-
173
-
174
-
175
-
176
-
177
-
178
-
179
-
180
-
181
-
182
-
183
-
184
-
185
-
186
-
187
-
188
-
189
-
190
-
191
-
192
-
193
-
194
-
195
-
196
-
197
-
198
-
199
-
200
-
201
-
202
-
203
-
204
-
205
-
206
-
207
-
208
-
209
-
210
-
211
-
212
-
213
-
214
-
215
-
216
-
217
-
218
-
219
-
220
-
221
-
222
-
223
-
224
-
225
-
226
-
227
-
228
-
229
-
230
-
231
-
232
-
233
-
234
-
235
-
236
-
237
-
238
-
239
-
240
-
241
-
242
-
243
-
244
-
245
-
246
-
247
-
248
-
249
-
250
-
251
-
252
-
253
-
254
-
255
-
256
-
257
-
258
-
259
-
260
-
261
-
262
-
263
-
264
-
265
-
266
-
267
-
268
-
269
-
270
-
271
-
272
 |
 |

70 Bank of America 2014
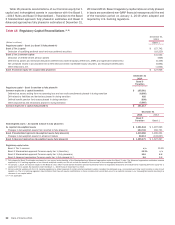
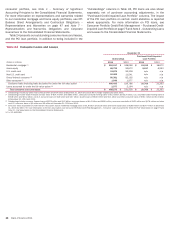
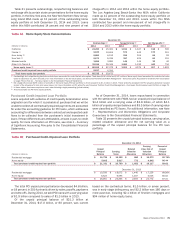
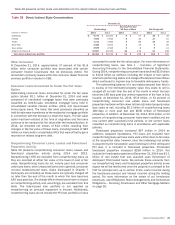
Table 27 presents outstandings, nonperforming balances, net charge-offs, allowance for loan and lease losses and provision for
loan and lease losses for the Core portfolio and the Legacy Assets & Servicing portfolio within the home loans portfolio. For more
information on Legacy Assets & Servicing, see CRES on page 35.
Table 27 Home Loans Portfolio (1)
December 31
Outstandings Nonperforming Net Charge-offs (2)
(Dollars in millions) 2014 2013 2014 2013 2014 2013
Core portfolio
Residential mortgage $ 162,220 $177,336 $ 2,398 $ 3,316 $140 $ 274
Home equity 51,887 54,499 1,496 1,431 275 439
Total Core portfolio 214,107 231,835 3,894 4,747 415 713
Legacy Assets & Servicing portfolio
Residential mortgage 53,977 70,730 4,491 8,396 (254)810
Home equity 33,838 39,173 2,405 2,644 632 1,364
Total Legacy Assets & Servicing portfolio 87,815 109,903 6,896 11,040 378 2,174
Home loans portfolio
Residential mortgage 216,197 248,066 6,889 11,712 (114)1,084
Home equity 85,725 93,672 3,901 4,075 907 1,803
Total home loans portfolio $ 301,922 $341,738 $ 10,790 $ 15,787 $793 $ 2,887
December 31
Allowance for Loan
and Lease Losses
Provision for Loan
and Lease Losses
2014 2013 2014 2013
Core portfolio
Residential mortgage $593 $ 728 $(47)
$ 166
Home equity 702 965 3119
Total Core portfolio 1,295 1,693 (44) 285
Legacy Assets & Servicing portfolio
Residential mortgage 2,307 3,356 (696)(979)
Home equity 2,333 3,469 (236)(430)
Total Legacy Assets & Servicing portfolio 4,640 6,825 (932)(1,409)
Home loans portfolio
Residential mortgage 2,900 4,084 (743)(813)
Home equity 3,035 4,434 (233)(311)
Total home loans portfolio $ 5,935 $ 8,518 $(976)$ (1,124)
(1) Outstandings and nonperforming amounts exclude loans accounted for under the fair value option. Consumer loans accounted for under the fair value option include residential mortgage loans of
$1.9 billion and $2.0 billion and home equity loans of $196 million and $147 million at December 31, 2014 and 2013. For more information on the fair value option, see Consumer Portfolio Credit
Risk Management – Consumer Loans Accounted for Under the Fair Value Option on page 79 and Note 21 – Fair Value Option to the Consolidated Financial Statements.
(2) Net charge-offs exclude write-offs in the PCI loan portfolio of $545 million in residential mortgage and $265 million in home equity in 2014, which are included in the Legacy Assets & Servicing
portfolio, compared to $1.1 billion in residential mortgage and $1.2 billion in home equity in 2013. Write-offs in the PCI loan portfolio decrease the PCI valuation allowance included as part of the
allowance for loan and lease losses. For more information on PCI write-offs, see Consumer Portfolio Credit Risk Management – Purchased Credit-impaired Loan Portfolio on page 75.
We believe that the presentation of information adjusted to
exclude the impact of the PCI loan portfolio, the fully-insured loan
portfolio and loans accounted for under the fair value option is
more representative of the ongoing operations and credit quality
of the business. As a result, in the following discussions of the
residential mortgage and home equity portfolios, we provide
information that excludes the impact of the PCI loan portfolio, the
fully-insured loan portfolio and loans accounted for under the fair
value option in certain credit quality statistics. We separately
disclose information on the PCI loan portfolio on page 75.
Residential Mortgage
The residential mortgage portfolio makes up the largest
percentage of our consumer loan portfolio at 44 percent of
consumer loans and leases at December 31, 2014. Approximately
24 percent of the residential mortgage portfolio is in GWIM and
represents residential mortgages that are originated for the home
purchase and refinancing needs of our wealth management
clients. The remaining portion of the portfolio is primarily in All
Other and is comprised of originated loans, purchased loans used
in our overall ALM activities, delinquent FHA loans repurchased
pursuant to our servicing agreements with GNMA as well as loans
repurchased related to our representations and warranties.
Outstanding balances in the residential mortgage portfolio,
excluding loans accounted for under the fair value option,
decreased $31.9 billion during 2014 due to paydowns, sales,
charge-offs and transfers to foreclosed properties. Of the decline,
more than 50 percent was due to the sale of $10.7 billion of loans
with standby insurance agreements and $6.7 billion of
nonperforming and other delinquent loan sales. These were
partially offset by new origination volume retained on our balance
sheet, as well as repurchases of delinquent loans pursuant to our
servicing agreements with GNMA, which are part of our mortgage
banking activities.
At December 31, 2014 and 2013, the residential mortgage
portfolio included $65.0 billion and $87.2 billion of outstanding
fully-insured loans. On this portion of the residential mortgage
portfolio, we are protected against principal loss as a result of
either FHA insurance or long-term standby agreements with FNMA
and FHLMC. At December 31, 2014 and 2013, $47.8 billion and