Bank of America 2014 Annual Report Download - page 25
Download and view the complete annual report
Please find page 25 of the 2014 Bank of America annual report below. You can navigate through the pages in the report by either clicking on the pages listed below, or by using the keyword search tool below to find specific information within the annual report.-
 1
1 -
2
-
3
-
4
-
5
-
6
-
7
-
8
-
9
-
10
-
11
-
12
-
13
-
14
-
 15
15 -
 16
16 -
 17
17 -
 18
18 -
 19
19 -
 20
20 -
 21
21 -
 22
22 -
 23
23 -
 24
24 -
 25
25 -
 26
26 -
 27
27 -
 28
28 -
 29
29 -
 30
30 -
 31
31 -
 32
32 -
 33
33 -
 34
34 -
 35
35 -
36
-
37
-
38
-
39
-
40
-
41
-
42
-
43
-
44
-
45
-
46
-
47
-
48
-
49
-
50
-
51
-
52
-
53
-
54
-
55
-
56
-
57
-
58
-
59
-
60
-
61
-
62
-
63
-
64
-
65
-
66
-
67
-
68
-
69
-
70
-
71
-
72
-
73
-
74
-
75
-
76
-
77
-
78
-
79
-
80
-
81
-
82
-
83
-
84
-
85
-
86
-
87
-
88
-
89
-
90
-
91
-
92
-
93
-
94
-
95
-
96
-
97
-
98
-
99
-
100
-
101
-
102
-
103
-
104
-
105
-
106
-
107
-
108
-
109
-
110
-
111
-
112
-
113
-
114
-
115
-
116
-
117
-
118
-
119
-
120
-
121
-
122
-
123
-
124
-
125
-
126
-
127
-
128
-
129
-
130
-
131
-
132
-
133
-
134
-
135
-
136
-
137
-
138
-
139
-
140
-
141
-
142
-
143
-
144
-
145
-
146
-
147
-
148
-
149
-
150
-
151
-
152
-
153
-
154
-
155
-
156
-
157
-
158
-
159
-
160
-
161
-
162
-
163
-
164
-
165
-
166
-
167
-
168
-
169
-
170
-
171
-
172
-
173
-
174
-
175
-
176
-
177
-
178
-
179
-
180
-
181
-
182
-
183
-
184
-
185
-
186
-
187
-
188
-
189
-
190
-
191
-
192
-
193
-
194
-
195
-
196
-
197
-
198
-
199
-
200
-
201
-
202
-
203
-
204
-
205
-
206
-
207
-
208
-
209
-
210
-
211
-
212
-
213
-
214
-
215
-
216
-
217
-
218
-
219
-
220
-
221
-
222
-
223
-
224
-
225
-
226
-
227
-
228
-
229
-
230
-
231
-
232
-
233
-
234
-
235
-
236
-
237
-
238
-
239
-
240
-
241
-
242
-
243
-
244
-
245
-
246
-
247
-
248
-
249
-
250
-
251
-
252
-
253
-
254
-
255
-
256
-
257
-
258
-
259
-
260
-
261
-
262
-
263
-
264
-
265
-
266
-
267
-
268
-
269
-
270
-
271
-
272
 |
 |

Bank of America 2014 23
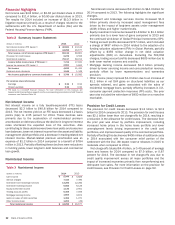
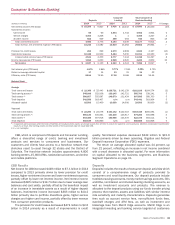
Noninterest Expense
Table 4 Noninterest Expense
(Dollars in millions) 2014 2013
Personnel $ 33,787 $ 34,719
Occupancy 4,260 4,475
Equipment 2,125 2,146
Marketing 1,829 1,834
Professional fees 2,472 2,884
Amortization of intangibles 936 1,086
Data processing 3,144 3,170
Telecommunications 1,259 1,593
Other general operating 25,305 17,307
Total noninterest expense $ 75,117 $ 69,214
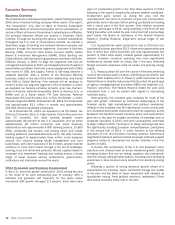
Noninterest expense increased $5.9 billion to $75.1 billion for
2014 compared to 2013 primarily driven by higher litigation
expense in other general operating expense. Litigation expense
increased $10.3 billion primarily as a result of charges related to
the settlements with the DoJ and FHFA. The increase in litigation
expense was partially offset by a decrease of $3.3 billion in default-
related staffing and other default-related servicing expenses in
Legacy Assets & Servicing. Also, personnel expense decreased
$932 million in 2014 as we continued to streamline processes
and achieve cost savings.
In connection with Project New BAC, which we first announced
in the third quarter of 2011, we expected to achieve cost savings
in certain noninterest expense categories as we streamlined
workflows, simplified processes and aligned expenses with our
overall strategic plan and operating principles. We expected total
cost savings from Project New BAC to reach $8 billion on an
annualized basis, or $2 billion per quarter, by mid-2015. We
successfully completed our Project New BAC expense program
ahead of schedule by reaching our target of $2 billion in cost
savings per quarter, in the third quarter of 2014.
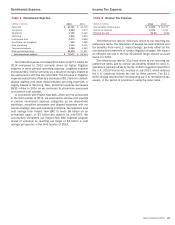
Income Tax Expense
Table 5 Income Tax Expense
(Dollars in millions) 2014 2013
Income before income taxes $ 6,855 $ 16,172
Income tax expense 2,022 4,741
Effective tax rate 29.5% 29.3%
The effective tax rate for 2014 was driven by our recurring tax
preference items, the resolution of several tax examinations and
tax benefits from non-U.S. restructurings, partially offset by the
non-deductible treatment of certain litigation charges. We expect
an effective tax rate in the low 30 percent range, absent unusual
items, for 2015.
The effective tax rate for 2013 was driven by our recurring tax
preference items and by certain tax benefits related to non-U.S.
operations, partially offset by the $1.1 billion negative impact from
the U.K. 2013 Finance Act, enacted in July 2013, which reduced
the U.K. corporate income tax rate by three percent. The $1.1
billion charge resulted from remeasuring our U.K. net deferred tax
assets, in the period of enactment, using the lower rates.