Bank of America 2014 Annual Report Download - page 110
Download and view the complete annual report
Please find page 110 of the 2014 Bank of America annual report below. You can navigate through the pages in the report by either clicking on the pages listed below, or by using the keyword search tool below to find specific information within the annual report.-
 1
1 -
2
-
3
-
4
-
5
-
6
-
7
-
8
-
9
-
10
-
11
-
12
-
13
-
14
-
15
-
16
-
17
-
18
-
19
-
20
-
21
-
22
-
23
-
24
-
25
-
26
-
27
-
28
-
29
-
30
-
31
-
32
-
33
-
34
-
35
-
36
-
37
-
38
-
39
-
40
-
41
-
42
-
43
-
44
-
45
-
46
-
47
-
48
-
49
-
50
-
51
-
52
-
53
-
54
-
55
-
56
-
57
-
58
-
59
-
60
-
61
-
62
-
63
-
64
-
65
-
66
-
67
-
68
-
69
-
70
-
71
-
72
-
73
-
74
-
75
-
76
-
77
-
78
-
79
-
80
-
81
-
82
-
83
-
84
-
85
-
86
-
87
-
88
-
89
-
90
-
91
-
92
-
93
-
94
-
95
-
96
-
97
-
98
-
99
-
 100
100 -
 101
101 -
 102
102 -
 103
103 -
 104
104 -
 105
105 -
 106
106 -
 107
107 -
 108
108 -
 109
109 -
 110
110 -
 111
111 -
 112
112 -
 113
113 -
 114
114 -
 115
115 -
 116
116 -
 117
117 -
 118
118 -
 119
119 -
 120
120 -
121
-
122
-
123
-
124
-
125
-
126
-
127
-
128
-
129
-
130
-
131
-
132
-
133
-
134
-
135
-
136
-
137
-
138
-
139
-
140
-
141
-
142
-
143
-
144
-
145
-
146
-
147
-
148
-
149
-
150
-
151
-
152
-
153
-
154
-
155
-
156
-
157
-
158
-
159
-
160
-
161
-
162
-
163
-
164
-
165
-
166
-
167
-
168
-
169
-
170
-
171
-
172
-
173
-
174
-
175
-
176
-
177
-
178
-
179
-
180
-
181
-
182
-
183
-
184
-
185
-
186
-
187
-
188
-
189
-
190
-
191
-
192
-
193
-
194
-
195
-
196
-
197
-
198
-
199
-
200
-
201
-
202
-
203
-
204
-
205
-
206
-
207
-
208
-
209
-
210
-
211
-
212
-
213
-
214
-
215
-
216
-
217
-
218
-
219
-
220
-
221
-
222
-
223
-
224
-
225
-
226
-
227
-
228
-
229
-
230
-
231
-
232
-
233
-
234
-
235
-
236
-
237
-
238
-
239
-
240
-
241
-
242
-
243
-
244
-
245
-
246
-
247
-
248
-
249
-
250
-
251
-
252
-
253
-
254
-
255
-
256
-
257
-
258
-
259
-
260
-
261
-
262
-
263
-
264
-
265
-
266
-
267
-
268
-
269
-
270
-
271
-
272
 |
 |

108 Bank of America 2014
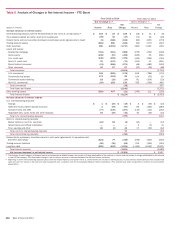
consumer MSRs and certain other assets at fair value. Also, we
account for certain loans and loan commitments, LHFS, short-term
borrowings, securities financing agreements, asset-backed
secured financings, long-term deposits and long-term debt under
the fair value option.
The fair values of assets and liabilities may include
adjustments, such as market liquidity and credit quality, where
appropriate. Valuations of products using models or other
techniques are sensitive to assumptions used for the significant
inputs. Where market data is available, the inputs used for
valuation reflect that information as of our valuation date. Inputs
to valuation models are considered unobservable if they are
supported by little or no market activity. In periods of extreme
volatility, lessened liquidity or in illiquid markets, there may be
more variability in market pricing or a lack of market data to use
in the valuation process. In keeping with the prudent application
of estimates and management judgment in determining the fair
value of assets and liabilities, we have in place various processes
and controls that include: a model validation policy that requires
review and approval of quantitative models used for deal pricing,
financial statement fair value determination and risk
quantification; a trading product valuation policy that requires
verification of all traded product valuations; and a periodic review
and substantiation of daily profit and loss reporting for all traded
products. Primarily through validation controls, we utilize both
broker and pricing service inputs which can and do include both
market-observable and internally-modeled values and/or valuation
inputs. Our reliance on this information is affected by our
understanding of how the broker and/or pricing service develops
its data with a higher degree of reliance applied to those that are
more directly observable and lesser reliance applied to those
developed through their own internal modeling. Similarly, broker
quotes that are executable are given a higher level of reliance than
indicative broker quotes, which are not executable. These
processes and controls are performed independently of the
business. For additional information, see Note 20 – Fair Value
Measurements and Note 21 – Fair Value Option to the Consolidated
Financial Statements.
In 2014, we adopted an FVA into valuation estimates primarily
to include funding costs on uncollateralized derivatives and
derivatives where we are not permitted to use the collateral
received. This change resulted in a pretax net FVA charge of $497
million. Significant judgment is required in modeling expected
exposure profiles and in discounting for the funding risk premium
inherent in these derivatives.
Level 3 Assets and Liabilities
Financial assets and liabilities where values are based on
valuation techniques that require inputs that are both
unobservable and are significant to the overall fair value
measurement are classified as Level 3 under the fair value
hierarchy established in applicable accounting guidance. The Level
3 financial assets and liabilities include certain loans, MBS, ABS,
CDOs, CLOs and structured liabilities, as well as highly structured,
complex or long-dated derivative contracts, private equity
investments and consumer MSRs. The fair value of these Level 3
financial assets and liabilities is determined using pricing models,
discounted cash flow methodologies or similar techniques for
which the determination of fair value requires significant
management judgment or estimation.
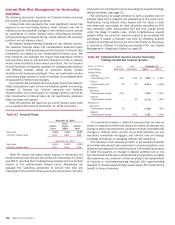
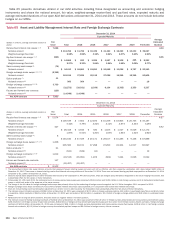
Table 66 Recurring Level 3 Asset and Liability Summary
December 31
2014 2013
(Dollars in millions)
Level 3
Fair Value
As a %
of Total
Level 3
Assets
As a %
of Total
Assets
Level 3
Fair Value
As a %
of Total
Level 3
Assets
As a %
of Total
Assets
Trading account assets $ 6,259 28.12% 0.30%$ 9,044 28.46% 0.43%
Derivative assets 6,851 30.77 0.33 7,277 22.90 0.35
AFS debt securities 2,555 11.48 0.12 4,760 14.98 0.23
All other Level 3 assets at fair value 6,597 29.63 0.31 10,697 33.66 0.50
Total Level 3 assets at fair value (1) $ 22,262 100.00% 1.06%$ 31,778 100.00% 1.51%
Level 3
Fair Value
As a %
of Total
Level 3
Liabilities
As a %
of Total
Liabilities
Level 3
Fair Value
As a %
of Total
Level 3
Liabilities
As a %
of Total
Liabilities
Derivative liabilities $ 7,771 76.34% 0.42%$ 7,501 78.66% 0.40%
Long-term debt 2,362 23.20 0.13 1,990 20.87 0.11
All other Level 3 liabilities at fair value 46 0.46 —45 0.47 —
Total Level 3 liabilities at fair value (1) $ 10,179 100.00% 0.55%$ 9,536 100.00% 0.51%
(1) Level 3 total assets and liabilities are shown before the impact of cash collateral and counterparty netting related to our derivative positions.
Level 3 financial instruments may be hedged with derivatives
classified as Level 1 or 2; therefore, gains or losses associated
with Level 3 financial instruments may be offset by gains or losses
associated with financial instruments classified in other levels of
the fair value hierarchy. The Level 3 gains and losses recorded in
earnings did not have a significant impact on our liquidity or capital
resources. We conduct a review of our fair value hierarchy
classifications on a quarterly basis. Transfers into or out of Level
3 are made if the significant inputs used in the financial models
measuring the fair values of the assets and liabilities became
unobservable or observable, respectively, in the current
marketplace. These transfers are considered to be effective as of
the beginning of the quarter in which they occur. For more
information on the significant transfers into and out of Level 3