Bank of America 2014 Annual Report Download - page 205
Download and view the complete annual report
Please find page 205 of the 2014 Bank of America annual report below. You can navigate through the pages in the report by either clicking on the pages listed below, or by using the keyword search tool below to find specific information within the annual report.-
 1
1 -
2
-
3
-
4
-
5
-
6
-
7
-
8
-
9
-
10
-
11
-
12
-
13
-
14
-
15
-
16
-
17
-
18
-
19
-
20
-
21
-
22
-
23
-
24
-
25
-
26
-
27
-
28
-
29
-
30
-
31
-
32
-
33
-
34
-
35
-
36
-
37
-
38
-
39
-
40
-
41
-
42
-
43
-
44
-
45
-
46
-
47
-
48
-
49
-
50
-
51
-
52
-
53
-
54
-
55
-
56
-
57
-
58
-
59
-
60
-
61
-
62
-
63
-
64
-
65
-
66
-
67
-
68
-
69
-
70
-
71
-
72
-
73
-
74
-
75
-
76
-
77
-
78
-
79
-
80
-
81
-
82
-
83
-
84
-
85
-
86
-
87
-
88
-
89
-
90
-
91
-
92
-
93
-
94
-
95
-
96
-
97
-
98
-
99
-
100
-
101
-
102
-
103
-
104
-
105
-
106
-
107
-
108
-
109
-
110
-
111
-
112
-
113
-
114
-
115
-
116
-
117
-
118
-
119
-
120
-
121
-
122
-
123
-
124
-
125
-
126
-
127
-
128
-
129
-
130
-
131
-
132
-
133
-
134
-
135
-
136
-
137
-
138
-
139
-
140
-
141
-
142
-
143
-
144
-
145
-
146
-
147
-
148
-
149
-
150
-
151
-
152
-
153
-
154
-
155
-
156
-
157
-
158
-
159
-
160
-
161
-
162
-
163
-
164
-
165
-
166
-
167
-
168
-
169
-
170
-
171
-
172
-
173
-
174
-
175
-
176
-
177
-
178
-
179
-
180
-
181
-
182
-
183
-
184
-
185
-
186
-
187
-
188
-
189
-
190
-
191
-
192
-
193
-
194
-
 195
195 -
 196
196 -
 197
197 -
 198
198 -
 199
199 -
 200
200 -
 201
201 -
 202
202 -
 203
203 -
 204
204 -
 205
205 -
 206
206 -
 207
207 -
 208
208 -
 209
209 -
 210
210 -
 211
211 -
 212
212 -
 213
213 -
 214
214 -
 215
215 -
216
-
217
-
218
-
219
-
220
-
221
-
222
-
223
-
224
-
225
-
226
-
227
-
228
-
229
-
230
-
231
-
232
-
233
-
234
-
235
-
236
-
237
-
238
-
239
-
240
-
241
-
242
-
243
-
244
-
245
-
246
-
247
-
248
-
249
-
250
-
251
-
252
-
253
-
254
-
255
-
256
-
257
-
258
-
259
-
260
-
261
-
262
-
263
-
264
-
265
-
266
-
267
-
268
-
269
-
270
-
271
-
272
 |
 |

Bank of America 2014 203
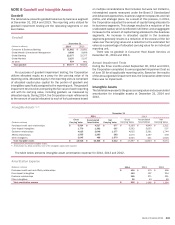
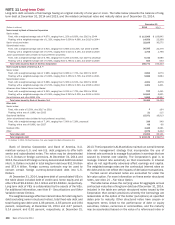
NOTE 8 Goodwill and Intangible Assets
Goodwill
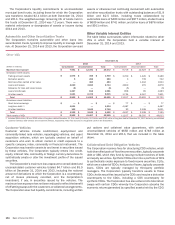
The table below presents goodwill balances by business segment
at December 31, 2014 and 2013. The reporting units utilized for
goodwill impairment testing are the operating segments or one
level below.
Goodwill
December 31
(Dollars in millions) 2014 2013
Consumer & Business Banking $ 31,681 $ 31,681
Global Wealth & Investment Management 9,698 9,698
Global Banking 22,377 22,377
Global Markets 5,197 5,197
All Other 824 891
Total goodwill $ 69,777 $ 69,844
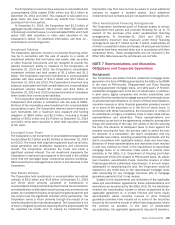
For purposes of goodwill impairment testing, the Corporation
utilizes allocated equity as a proxy for the carrying value of its
reporting units. Allocated equity in the reporting units is comprised
of allocated capital plus capital for the portion of goodwill and
intangibles specifically assigned to the reporting unit. The goodwill
impairment test involves comparing the fair value of each reporting
unit with its carrying value, including goodwill, as measured by
allocated equity. During 2014, the Corporation made refinements
to the amount of capital allocated to each of its businesses based
on multiple considerations that included, but were not limited to,
risk-weighted assets measured under the Basel 3 Standardized
and Advanced approaches, business segment exposures and risk
profile, and strategic plans. As a result of this process, in 2014,
the Corporation adjusted the amount of capital being allocated to
its business segments. This change resulted in a reduction of the
unallocated capital, which is reflected in All Other, and an aggregate
increase to the amount of capital being allocated to the business
segments. An increase in allocated capital in the business
segments generally results in a reduction of the excess of the fair
value over the carrying value and a reduction to the estimated fair
value as a percentage of allocated carrying value for an individual
reporting unit.
There was no goodwill in Consumer Real Estate Services at
December 31, 2014 and 2013.
Annual Impairment Tests
During the three months ended September 30, 2014 and 2013,
the Corporation completed its annual goodwill impairment test as
of June 30 for all applicable reporting units. Based on the results
of the annual goodwill impairment test, the Corporation determined
there was no impairment.
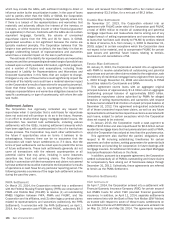
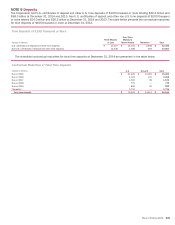
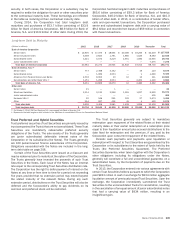
Intangible Assets
The table below presents the gross carrying value and accumulated
amortization for intangible assets at December 31, 2014 and
2013.
Intangible Assets (1, 2)
December 31
2014 2013
(Dollars in millions)
Gross
Carrying Value
Accumulated
Amortization
Net
Carrying Value
Gross
Carrying Value
Accumulated
Amortization
Net
Carrying Value
Purchased credit card relationships $ 5,504 $ 4,527 $ 977 $ 6,160 $ 4,849 $ 1,311
Core deposit intangibles 1,779 1,382 397 3,592 3,055 537
Customer relationships 4,025 2,648 1,377 4,025 2,281 1,744
Affinity relationships 1,565 1,283 282 1,575 1,197 378
Other intangibles 2,045 466 1,579 2,045 441 1,604
Total intangible assets $ 14,918 $ 10,306 $ 4,612 $ 17,397 $ 11,823 $ 5,574
(1) Excludes fully amortized intangible assets.
(2) At December 31, 2014 and 2013, none of the intangible assets were impaired.
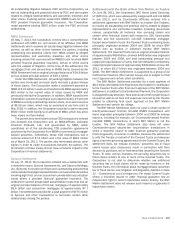
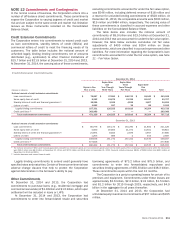
The table below presents intangible asset amortization expense for 2014, 2013 and 2012.
Amortization Expense
(Dollars in millions) 2014 2013 2012
Purchased credit card and Affinity relationships $415 $ 475 $ 556
Core deposit intangibles 140 197 254
Customer relationships 355 371 391
Other intangibles 26 43 63
Total amortization expense $ 936 $ 1,086 $ 1,264