Bank of America 2014 Annual Report Download - page 128
Download and view the complete annual report
Please find page 128 of the 2014 Bank of America annual report below. You can navigate through the pages in the report by either clicking on the pages listed below, or by using the keyword search tool below to find specific information within the annual report.-
 1
1 -
2
-
3
-
4
-
5
-
6
-
7
-
8
-
9
-
10
-
11
-
12
-
13
-
14
-
15
-
16
-
17
-
18
-
19
-
20
-
21
-
22
-
23
-
24
-
25
-
26
-
27
-
28
-
29
-
30
-
31
-
32
-
33
-
34
-
35
-
36
-
37
-
38
-
39
-
40
-
41
-
42
-
43
-
44
-
45
-
46
-
47
-
48
-
49
-
50
-
51
-
52
-
53
-
54
-
55
-
56
-
57
-
58
-
59
-
60
-
61
-
62
-
63
-
64
-
65
-
66
-
67
-
68
-
69
-
70
-
71
-
72
-
73
-
74
-
75
-
76
-
77
-
78
-
79
-
80
-
81
-
82
-
83
-
84
-
85
-
86
-
87
-
88
-
89
-
90
-
91
-
92
-
93
-
94
-
95
-
96
-
97
-
98
-
99
-
100
-
101
-
102
-
103
-
104
-
105
-
106
-
107
-
108
-
109
-
110
-
111
-
112
-
113
-
114
-
115
-
116
-
117
-
 118
118 -
 119
119 -
 120
120 -
 121
121 -
 122
122 -
 123
123 -
 124
124 -
 125
125 -
 126
126 -
 127
127 -
 128
128 -
 129
129 -
 130
130 -
 131
131 -
 132
132 -
 133
133 -
 134
134 -
 135
135 -
 136
136 -
 137
137 -
 138
138 -
139
-
140
-
141
-
142
-
143
-
144
-
145
-
146
-
147
-
148
-
149
-
150
-
151
-
152
-
153
-
154
-
155
-
156
-
157
-
158
-
159
-
160
-
161
-
162
-
163
-
164
-
165
-
166
-
167
-
168
-
169
-
170
-
171
-
172
-
173
-
174
-
175
-
176
-
177
-
178
-
179
-
180
-
181
-
182
-
183
-
184
-
185
-
186
-
187
-
188
-
189
-
190
-
191
-
192
-
193
-
194
-
195
-
196
-
197
-
198
-
199
-
200
-
201
-
202
-
203
-
204
-
205
-
206
-
207
-
208
-
209
-
210
-
211
-
212
-
213
-
214
-
215
-
216
-
217
-
218
-
219
-
220
-
221
-
222
-
223
-
224
-
225
-
226
-
227
-
228
-
229
-
230
-
231
-
232
-
233
-
234
-
235
-
236
-
237
-
238
-
239
-
240
-
241
-
242
-
243
-
244
-
245
-
246
-
247
-
248
-
249
-
250
-
251
-
252
-
253
-
254
-
255
-
256
-
257
-
258
-
259
-
260
-
261
-
262
-
263
-
264
-
265
-
266
-
267
-
268
-
269
-
270
-
271
-
272
 |
 |

126 Bank of America 2014
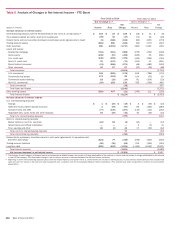
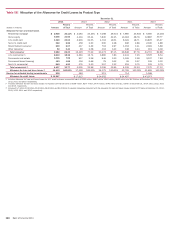
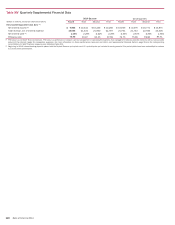
Table XII Selected Quarterly Financial Data
2014 Quarters 2013 Quarters
(In millions, except per share information) Fourth Third Second First Fourth Third Second First
Income statement
Net interest income $ 9,635 $ 10,219 $ 10,013 $ 10,085 $ 10,786 $ 10,266 $ 10,549 $ 10,664
Noninterest income 9,090 10,990 11,734 12,481 10,702 11,264 12,178 12,533
Total revenue, net of interest expense 18,725 21,209 21,747 22,566 21,488 21,530 22,727 23,197
Provision for credit losses 219 636 411 1,009 336 296 1,211 1,713
Noninterest expense 14,196 20,142 18,541 22,238 17,307 16,389 16,018 19,500
Income (loss) before income taxes 4,310 431 2,795 (681) 3,845 4,845 5,498 1,984
Income tax expense (benefit) 1,260 663 504 (405) 406 2,348 1,486 501
Net income (loss) 3,050 (232) 2,291 (276) 3,439 2,497 4,012 1,483
Net income (loss) applicable to common shareholders 2,738 (470) 2,035 (514) 3,183 2,218 3,571 1,110
Average common shares issued and outstanding 10,516 10,516 10,519 10,561 10,633 10,719 10,776 10,799
Average diluted common shares issued and outstanding (1) 11,274 10,516 11,265 10,561 11,404 11,482 11,525 11,155
Performance ratios
Return on average assets 0.57% n/m 0.42% n/m 0.64% 0.47% 0.74% 0.27%
Four quarter trailing return on average assets (2) 0.23 0.24% 0.37 0.45% 0.53 0.40 0.30 0.23
Return on average common shareholders’ equity 4.84 n/m 3.68 n/m 5.74 4.06 6.55 2.06
Return on average tangible common shareholders’ equity (3) 7.15 n/m 5.47 n/m 8.61 6.15 9.88 3.12
Return on average tangible shareholders’ equity (3) 7.08 n/m 5.64 n/m 8.53 6.32 9.98 3.69
Total ending equity to total ending assets 11.57 11.24 10.94 10.79 11.07 10.92 10.88 10.91
Total average equity to total average assets 11.39 11.14 10.87 11.06 10.93 10.85 10.76 10.71
Dividend payout 19.21 n/m 5.16 n/m 3.33 4.82 3.01 9.75
Per common share data
Earnings (loss) $0.26
$ (0.04) $ 0.19 $ (0.05) $ 0.30 $ 0.21 $ 0.33 $ 0.10
Diluted earnings (loss) (1) 0.25 (0.04) 0.19 (0.05) 0.29 0.20 0.32 0.10
Dividends paid 0.05 0.05 0.01 0.01 0.01 0.01 0.01 0.01
Book value 21.32 20.99 21.16 20.75 20.71 20.50 20.18 20.19
Tangible book value (3) 14.43 14.09 14.24 13.81 13.79 13.62 13.32 13.36
Market price per share of common stock
Closing $ 17.89 $ 17.05 $ 15.37 $ 17.20 $ 15.57 $ 13.80 $ 12.86 $ 12.18
High closing 18.13 17.18 17.34 17.92 15.88 14.95 13.83 12.78
Low closing 15.76 14.98 14.51 16.10 13.69 12.83 11.44 11.03
Market capitalization $ 188,141 $ 179,296 $ 161,628 $ 181,117 $ 164,914 $ 147,429 $ 138,156 $ 131,817
(1) The diluted earnings (loss) per common share excluded the effect of any equity instruments that are antidilutive to earnings per share. There were no potential common shares that were dilutive in
the third and first quarters of 2014 because of the net loss applicable to common shareholders.
(2) Calculated as total net income (loss) for four consecutive quarters divided by annualized average assets for four consecutive quarters.
(3) Tangible equity ratios and tangible book value per share of common stock are non-GAAP financial measures. Other companies may define or calculate these measures differently. For more information
on these ratios, see Supplemental Financial Data on page 29, and for corresponding reconciliations to GAAP financial measures, see Statistical Table XVII.
(4) For more information on the impact of the purchased credit-impaired loan portfolio on asset quality, see Consumer Portfolio Credit Risk Management on page 67.
(5) Includes the allowance for loan and lease losses and the reserve for unfunded lending commitments.
(6) Balances and ratios do not include loans accounted for under the fair value option. For additional exclusions from nonperforming loans, leases and foreclosed properties, see Consumer Portfolio
Credit Risk Management – Nonperforming Consumer Loans, Leases and Foreclosed Properties Activity on page 79 and corresponding Table 39, and Commercial Portfolio Credit Risk Management –
Nonperforming Commercial Loans, Leases and Foreclosed Properties Activity on page 86 and corresponding Table 48.
(7) Primarily includes amounts allocated to the U.S. credit card and unsecured consumer lending portfolios in CBB, purchased credit-impaired loans and the non-U.S. credit card portfolio in All Other.
(8) Net charge-offs exclude $13 million, $246 million, $160 million and $391 million of write-offs in the purchased credit-impaired loan portfolio in the fourth, third, second and first quarters of 2014,
respectively, and $741 million, $443 million, $313 million and $839 million in the fourth, third, second and first quarters of 2013, respectively. These write-offs decreased the purchased credit-
impaired valuation allowance included as part of the allowance for loan and lease losses. For more information on purchased credit-impaired write-offs, see Consumer Portfolio Credit Risk Management
– Purchased Credit-impaired Loan Portfolio on page 75.
(9) On January 1, 2014, the Basel 3 rules became effective, subject to transition provisions primarily related to regulatory deductions and adjustments impacting Common equity tier 1 capital and Tier
1 capital. We reported under Basel 1 (which included the Market Risk Final Rules) for 2013.
n/a = not applicable
n/m = not meaningful