Bank of America 2014 Annual Report Download - page 233
Download and view the complete annual report
Please find page 233 of the 2014 Bank of America annual report below. You can navigate through the pages in the report by either clicking on the pages listed below, or by using the keyword search tool below to find specific information within the annual report.-
 1
1 -
2
-
3
-
4
-
5
-
6
-
7
-
8
-
9
-
10
-
11
-
12
-
13
-
14
-
15
-
16
-
17
-
18
-
19
-
20
-
21
-
22
-
23
-
24
-
25
-
26
-
27
-
28
-
29
-
30
-
31
-
32
-
33
-
34
-
35
-
36
-
37
-
38
-
39
-
40
-
41
-
42
-
43
-
44
-
45
-
46
-
47
-
48
-
49
-
50
-
51
-
52
-
53
-
54
-
55
-
56
-
57
-
58
-
59
-
60
-
61
-
62
-
63
-
64
-
65
-
66
-
67
-
68
-
69
-
70
-
71
-
72
-
73
-
74
-
75
-
76
-
77
-
78
-
79
-
80
-
81
-
82
-
83
-
84
-
85
-
86
-
87
-
88
-
89
-
90
-
91
-
92
-
93
-
94
-
95
-
96
-
97
-
98
-
99
-
100
-
101
-
102
-
103
-
104
-
105
-
106
-
107
-
108
-
109
-
110
-
111
-
112
-
113
-
114
-
115
-
116
-
117
-
118
-
119
-
120
-
121
-
122
-
123
-
124
-
125
-
126
-
127
-
128
-
129
-
130
-
131
-
132
-
133
-
134
-
135
-
136
-
137
-
138
-
139
-
140
-
141
-
142
-
143
-
144
-
145
-
146
-
147
-
148
-
149
-
150
-
151
-
152
-
153
-
154
-
155
-
156
-
157
-
158
-
159
-
160
-
161
-
162
-
163
-
164
-
165
-
166
-
167
-
168
-
169
-
170
-
171
-
172
-
173
-
174
-
175
-
176
-
177
-
178
-
179
-
180
-
181
-
182
-
183
-
184
-
185
-
186
-
187
-
188
-
189
-
190
-
191
-
192
-
193
-
194
-
195
-
196
-
197
-
198
-
199
-
200
-
201
-
202
-
203
-
204
-
205
-
206
-
207
-
208
-
209
-
210
-
211
-
212
-
213
-
214
-
215
-
216
-
217
-
218
-
219
-
220
-
221
-
222
-
 223
223 -
 224
224 -
 225
225 -
 226
226 -
 227
227 -
 228
228 -
 229
229 -
 230
230 -
 231
231 -
 232
232 -
 233
233 -
 234
234 -
 235
235 -
 236
236 -
 237
237 -
 238
238 -
 239
239 -
 240
240 -
 241
241 -
 242
242 -
 243
243 -
244
-
245
-
246
-
247
-
248
-
249
-
250
-
251
-
252
-
253
-
254
-
255
-
256
-
257
-
258
-
259
-
260
-
261
-
262
-
263
-
264
-
265
-
266
-
267
-
268
-
269
-
270
-
271
-
272
 |
 |

Bank of America 2014 231
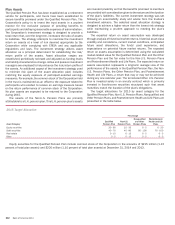
Postretirement Health and Life Plans is 7.00 percent for 2015 and
2016, reducing in steps to 5.00 percent in 2021 and later years.
A one-percentage-point increase in assumed health care cost trend
rates would have increased the service and interest costs, and
the benefit obligation by $2 million and $47 million in 2014. A
one-percentage-point decrease in assumed health care cost trend
rates would have lowered the service and interest costs, and the
benefit obligation by $2 million and $41 million in 2014.
The Corporation’s net periodic benefit cost (income) recognized
for the plans is sensitive to the discount rate and expected return
on plan assets. With all other assumptions held constant, a 25
basis point (bp) decline in the discount rate and expected return
on plan asset assumptions would have resulted in an increase in
the net periodic benefit cost for the Qualified Pension Plan
recognized in 2014 of approximately $7 million and $43 million,
and to be recognized in 2015 of approximately $9 million and $44
million. For the Postretirement Health and Life Plans, a 25 bp
decline in the discount rate would have resulted in an increase in
the net periodic benefit cost recognized in 2014 of approximately
$9 million, and to be recognized in 2015 of approximately $10
million. For the Non-U.S. Pension Plans and the Nonqualified and
Other Pension Plans, a 25 bp decline in discount rates would not
have a significant impact on the net periodic benefit cost for 2014
and 2015.
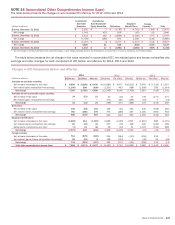
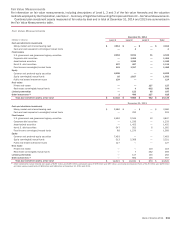
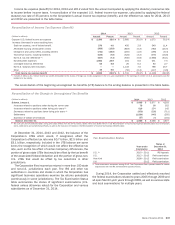
Pretax amounts included in accumulated OCI for employee
benefit plans at December 31, 2014 and 2013 are presented in
the table below.
Pretax Amounts included in Accumulated OCI
Qualified
Pension Plan
Non-U.S.
Pension Plans
Nonqualified
and Other
Pension Plans
Postretirement
Health and
Life Plans Total
(Dollars in millions) 2014 2013 2014 2013 2014 2013 2014 2013 2014 2013
Net actuarial loss (gain) $ 4,061 $ 2,794 $355 $ 271 $968 $ 855 $(56)
$ (171) $ 5,328 $ 3,749
Prior service cost (credits) ——(9) (9)——20 24 11 15
Amounts recognized in accumulated OCI $ 4,061 $ 2,794 $346 $ 262 $968 $ 855 $(36)
$ (147) $ 5,339 $ 3,764
Pretax amounts recognized in OCI for employee benefit plans in 2014 included the following components.
Pretax Amounts Recognized in OCI in 2014
(Dollars in millions)
Qualified
Pension Plan
Non-U.S.
Pension Plans
Nonqualified
and Other
Pension Plans
Postretirement
Health and
Life Plans Total
Current year actuarial loss $ 1,378 $ 87 $ 138 $ 26 $ 1,629
Amortization of actuarial gain (loss) (111) (3) (25) 89 (50)
Current year prior service cost — 1 — — 1
Amortization of prior service cost — (1) — (4) (5)
Amounts recognized in OCI $ 1,267 $ 84 $ 113 $111 $ 1,575
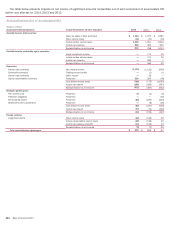
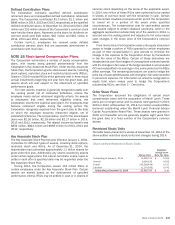
The estimated pretax amounts that will be amortized from accumulated OCI into expense in 2015 are presented in the table below.
Estimated Pretax Amounts Amortized from Accumulated OCI into Period Cost in 2015
(Dollars in millions)
Qualified
Pension Plan
Non-U.S.
Pension Plans
Nonqualified
and Other
Pension Plans
Postretirement
Health and
Life Plans Total
Net actuarial loss (gain) $ 166 $ 6 $ 34 $ (34) $ 172
Prior service cost — 1 — 4 5
Total amounts amortized from accumulated OCI $ 166 $ 7 $ 34 $ (30) $ 177