Bank of America 2014 Annual Report Download - page 105
Download and view the complete annual report
Please find page 105 of the 2014 Bank of America annual report below. You can navigate through the pages in the report by either clicking on the pages listed below, or by using the keyword search tool below to find specific information within the annual report.-
 1
1 -
2
-
3
-
4
-
5
-
6
-
7
-
8
-
9
-
10
-
11
-
12
-
13
-
14
-
15
-
16
-
17
-
18
-
19
-
20
-
21
-
22
-
23
-
24
-
25
-
26
-
27
-
28
-
29
-
30
-
31
-
32
-
33
-
34
-
35
-
36
-
37
-
38
-
39
-
40
-
41
-
42
-
43
-
44
-
45
-
46
-
47
-
48
-
49
-
50
-
51
-
52
-
53
-
54
-
55
-
56
-
57
-
58
-
59
-
60
-
61
-
62
-
63
-
64
-
65
-
66
-
67
-
68
-
69
-
70
-
71
-
72
-
73
-
74
-
75
-
76
-
77
-
78
-
79
-
80
-
81
-
82
-
83
-
84
-
85
-
86
-
87
-
88
-
89
-
90
-
91
-
92
-
93
-
94
-
 95
95 -
 96
96 -
 97
97 -
 98
98 -
 99
99 -
 100
100 -
 101
101 -
 102
102 -
 103
103 -
 104
104 -
 105
105 -
 106
106 -
 107
107 -
 108
108 -
 109
109 -
 110
110 -
 111
111 -
 112
112 -
 113
113 -
 114
114 -
 115
115 -
116
-
117
-
118
-
119
-
120
-
121
-
122
-
123
-
124
-
125
-
126
-
127
-
128
-
129
-
130
-
131
-
132
-
133
-
134
-
135
-
136
-
137
-
138
-
139
-
140
-
141
-
142
-
143
-
144
-
145
-
146
-
147
-
148
-
149
-
150
-
151
-
152
-
153
-
154
-
155
-
156
-
157
-
158
-
159
-
160
-
161
-
162
-
163
-
164
-
165
-
166
-
167
-
168
-
169
-
170
-
171
-
172
-
173
-
174
-
175
-
176
-
177
-
178
-
179
-
180
-
181
-
182
-
183
-
184
-
185
-
186
-
187
-
188
-
189
-
190
-
191
-
192
-
193
-
194
-
195
-
196
-
197
-
198
-
199
-
200
-
201
-
202
-
203
-
204
-
205
-
206
-
207
-
208
-
209
-
210
-
211
-
212
-
213
-
214
-
215
-
216
-
217
-
218
-
219
-
220
-
221
-
222
-
223
-
224
-
225
-
226
-
227
-
228
-
229
-
230
-
231
-
232
-
233
-
234
-
235
-
236
-
237
-
238
-
239
-
240
-
241
-
242
-
243
-
244
-
245
-
246
-
247
-
248
-
249
-
250
-
251
-
252
-
253
-
254
-
255
-
256
-
257
-
258
-
259
-
260
-
261
-
262
-
263
-
264
-
265
-
266
-
267
-
268
-
269
-
270
-
271
-
272
 |
 |
Bank of America 2014 103
Securities
The securities portfolio is an integral part of our interest rate risk
management, which includes our ALM positioning, and is primarily
comprised of debt securities including MBS and U.S. Treasury
securities. As part of the ALM positioning, we use derivatives to
hedge interest rate and duration risk. At December 31, 2014 and
2013, our debt securities portfolio had a carrying value of $380.5
billion and $323.9 billion.
During 2014 and 2013, we purchased debt securities of
$293.8 billion and $190.4 billion, sold $157.7 billion and $117.7
billion, and had maturities and received paydowns of $87.6 billion
and $94.0 billion, respectively. We realized $1.4 billion and $1.3
billion in net gains on sales of AFS debt securities.
At December 31, 2014, accumulated OCI included after-tax net
unrealized gains of $1.3 billion on AFS debt securities and after-
tax net unrealized gains of $17 million on AFS marketable equity
securities compared to after-tax net unrealized losses of $3.3
billion and after-tax net unrealized losses of $4 million at
December 31, 2013. For more information on accumulated OCI,
see Note 14 – Accumulated Other Comprehensive Income (Loss)
to the Consolidated Financial Statements. The pretax net amounts
in accumulated OCI related to AFS debt securities increased $7.4
billion during 2014 to a $2.2 billion net unrealized gain primarily
due to the impact of interest rates. For more information on our
securities portfolio, see Note 3 – Securities to the Consolidated
Financial Statements.
We recognized $16 million of other-than-temporary impairment
(OTTI) losses in earnings on AFS debt securities in 2014 compared
to losses of $20 million in 2013. OTTI losses during 2014 and
2013 were on non-agency RMBS and were recorded in other
income on the Consolidated Statement of Income. The recognition
of OTTI losses is based on a variety of factors, including the length
of time and extent to which the market value has been less than
amortized cost, the financial condition of the issuer of the security
including credit ratings and any specific events affecting the
operations of the issuer, underlying assets that collateralize the
debt security, other industry and macroeconomic conditions, and
our intent and ability to hold the security to recovery.
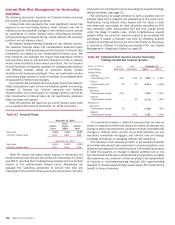
Residential Mortgage Portfolio
At December 31, 2014 and 2013, our residential mortgage
portfolio was $216.2 billion and $248.1 billion excluding $1.9
billion and $2.0 billion of consumer residential mortgage loans
accounted for under the fair value option at each period end. For
more information on consumer fair value option loans, see
Consumer Portfolio Credit Risk Management – Consumer Loans
Accounted for Under the Fair Value Option on page 79. The $31.9
billion decrease in 2014 was primarily due to paydowns, sales,
charge-offs and transfers to foreclosed properties. Of the decline,
more than 50 percent was due to the sale of $10.7 billion of loans
with standby insurance agreements and $6.7 billion of
nonperforming and other delinquent loan sales. These were
partially offset by new origination volume retained on our balance
sheet, as well as repurchases of delinquent loans pursuant to our
servicing agreements with GNMA, which are part of our mortgage
banking activities.
During 2014, CRES and GWIM originated $23.2 billion of first-
lien mortgages that we retained compared to $44.5 billion in 2013.
We received paydowns of $37.8 billion in 2014 compared to $53.0
billion in 2013. We repurchased $5.0 billion of loans pursuant to
our servicing agreements with GNMA and redelivered $3.6 billion,
primarily FHA-insured loans, compared to repurchases of $10.4
billion and redeliveries of $5.0 billion in 2013. Sales of loans,
excluding redelivered FHA-insured loans, during 2014 were $17.4
billion compared to $4.0 billion in 2013. Gains recognized on the
sales of residential mortgage loans during 2014 were $668 million
compared to $75 million in 2013.
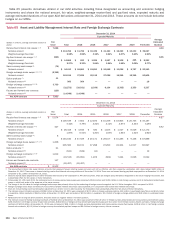
Interest Rate and Foreign Exchange Derivative
Contracts
Interest rate and foreign exchange derivative contracts are utilized
in our ALM activities and serve as an efficient tool to manage our
interest rate and foreign exchange risk. We use derivatives to
hedge the variability in cash flows or changes in fair value on our
balance sheet due to interest rate and foreign exchange
components. For more information on our hedging activities, see
Note 2 – Derivatives to the Consolidated Financial Statements.
Our interest rate contracts are generally non-leveraged generic
interest rate and foreign exchange basis swaps, options, futures
and forwards. In addition, we use foreign exchange contracts,
including cross-currency interest rate swaps, foreign currency
futures contracts, foreign currency forward contracts and options
to mitigate the foreign exchange risk associated with foreign
currency-denominated assets and liabilities.
Changes to the composition of our derivatives portfolio during
2014 reflect actions taken for interest rate and foreign exchange
rate risk management. The decisions to reposition our derivatives
portfolio are based on the current assessment of economic and
financial conditions including the interest rate and foreign currency
environments, balance sheet composition and trends, and the
relative mix of our cash and derivative positions.