Bank of America 2014 Annual Report Download - page 121
Download and view the complete annual report
Please find page 121 of the 2014 Bank of America annual report below. You can navigate through the pages in the report by either clicking on the pages listed below, or by using the keyword search tool below to find specific information within the annual report.-
 1
1 -
2
-
3
-
4
-
5
-
6
-
7
-
8
-
9
-
10
-
11
-
12
-
13
-
14
-
15
-
16
-
17
-
18
-
19
-
20
-
21
-
22
-
23
-
24
-
25
-
26
-
27
-
28
-
29
-
30
-
31
-
32
-
33
-
34
-
35
-
36
-
37
-
38
-
39
-
40
-
41
-
42
-
43
-
44
-
45
-
46
-
47
-
48
-
49
-
50
-
51
-
52
-
53
-
54
-
55
-
56
-
57
-
58
-
59
-
60
-
61
-
62
-
63
-
64
-
65
-
66
-
67
-
68
-
69
-
70
-
71
-
72
-
73
-
74
-
75
-
76
-
77
-
78
-
79
-
80
-
81
-
82
-
83
-
84
-
85
-
86
-
87
-
88
-
89
-
90
-
91
-
92
-
93
-
94
-
95
-
96
-
97
-
98
-
99
-
100
-
101
-
102
-
103
-
104
-
105
-
106
-
107
-
108
-
109
-
110
-
 111
111 -
 112
112 -
 113
113 -
 114
114 -
 115
115 -
 116
116 -
 117
117 -
 118
118 -
 119
119 -
 120
120 -
 121
121 -
 122
122 -
 123
123 -
 124
124 -
 125
125 -
 126
126 -
 127
127 -
 128
128 -
 129
129 -
 130
130 -
 131
131 -
132
-
133
-
134
-
135
-
136
-
137
-
138
-
139
-
140
-
141
-
142
-
143
-
144
-
145
-
146
-
147
-
148
-
149
-
150
-
151
-
152
-
153
-
154
-
155
-
156
-
157
-
158
-
159
-
160
-
161
-
162
-
163
-
164
-
165
-
166
-
167
-
168
-
169
-
170
-
171
-
172
-
173
-
174
-
175
-
176
-
177
-
178
-
179
-
180
-
181
-
182
-
183
-
184
-
185
-
186
-
187
-
188
-
189
-
190
-
191
-
192
-
193
-
194
-
195
-
196
-
197
-
198
-
199
-
200
-
201
-
202
-
203
-
204
-
205
-
206
-
207
-
208
-
209
-
210
-
211
-
212
-
213
-
214
-
215
-
216
-
217
-
218
-
219
-
220
-
221
-
222
-
223
-
224
-
225
-
226
-
227
-
228
-
229
-
230
-
231
-
232
-
233
-
234
-
235
-
236
-
237
-
238
-
239
-
240
-
241
-
242
-
243
-
244
-
245
-
246
-
247
-
248
-
249
-
250
-
251
-
252
-
253
-
254
-
255
-
256
-
257
-
258
-
259
-
260
-
261
-
262
-
263
-
264
-
265
-
266
-
267
-
268
-
269
-
270
-
271
-
272
 |
 |

Bank of America 2014 119
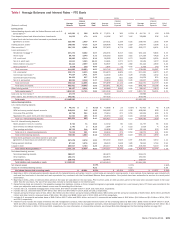
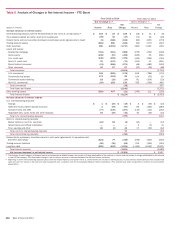
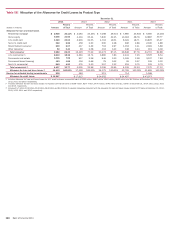
Table IV Outstanding Loans and Leases
December 31
(Dollars in millions) 2014 2013 2012 2011 2010
Consumer
Residential mortgage (1) $ 216,197 $248,066 $252,929 $273,228 $ 270,901
Home equity 85,725 93,672 108,140 124,856 138,161
U.S. credit card 91,879 92,338 94,835 102,291 113,785
Non-U.S. credit card 10,465 11,541 11,697 14,418 27,465
Direct/Indirect consumer (2) 80,381 82,192 83,205 89,713 90,308
Other consumer (3) 1,846 1,977 1,628 2,688 2,830
Total consumer loans excluding loans accounted for under the fair value option 486,493 529,786 552,434 607,194 643,450
Consumer loans accounted for under the fair value option (4) 2,077 2,164 1,005 2,190 —
Total consumer 488,570 531,950 553,439 609,384 643,450
Commercial
U.S. commercial (5) 233,586 225,851 209,719 193,199 190,305
Commercial real estate (6) 47,682 47,893 38,637 39,596 49,393
Commercial lease financing 24,866 25,199 23,843 21,989 21,942
Non-U.S. commercial 80,083 89,462 74,184 55,418 32,029
Total commercial loans excluding loans accounted for under the fair value option 386,217 388,405 346,383 310,202 293,669
Commercial loans accounted for under the fair value option (4) 6,604 7,878 7,997 6,614 3,321
Total commercial 392,821 396,283 354,380 316,816 296,990
Total loans and leases $ 881,391 $928,233 $907,819 $926,200 $ 940,440
(1) Includes pay option loans of $3.2 billion, $4.4 billion, $6.7 billion, $9.9 billion and $11.8 billion and non-U.S. residential mortgage loans of $2 million, $0, $93 million, $85 million and $90 million
at December 31, 2014, 2013, 2012, 2011 and 2010, respectively. The Corporation no longer originates pay option loans.
(2) Includes dealer financial services loans of $37.7 billion, $38.5 billion, $35.9 billion, $43.0 billion and $43.3 billion, unsecured consumer lending loans of $1.5 billion, $2.7 billion, $4.7 billion, $8.0
billion and $12.4 billion, U.S. securities-based lending loans of $35.8 billion, $31.2 billion, $28.3 billion, $23.6 billion and $16.6 billion, non-U.S. consumer loans of $4.0 billion, $4.7 billion, $8.3
billion, $7.6 billion and $8.0 billion, student loans of $632 million, $4.1 billion, $4.8 billion, $6.0 billion and $6.8 billion, and other consumer loans of $761 million, $1.0 billion, $1.2 billion, $1.5
billion and $3.2 billion at December 31, 2014, 2013, 2012, 2011 and 2010, respectively.
(3) Includes consumer finance loans of $676 million, $1.2 billion, $1.4 billion, $1.7 billion and $1.9 billion, consumer leases of $1.0 billion, $606 million, $34 million, $0 and $0, consumer overdrafts
of $162 million, $176 million, $177 million, $103 million and $88 million, and other non-U.S. consumer loans of $3 million, $5 million, $5 million, $929 million and $803 million at December 31,
2014, 2013, 2012, 2011 and 2010, respectively.
(4) Consumer loans accounted for under the fair value option were residential mortgage loans of $1.9 billion, $2.0 billion, $1.0 billion and $2.2 billion, and home equity loans of $196 million, $147
million, $0 and $0 at December 31, 2014, 2013, 2012 and 2011, respectively. There were no consumer loans accounted for under the fair value option prior to 2011. Commercial loans accounted
for under the fair value option were U.S. commercial loans of $1.9 billion, $1.5 billion, $2.3 billion, $2.2 billion and $1.6 billion, commercial real estate loans of $0, $0, $0, $0 and $79 million, and
non-U.S. commercial loans of $4.7 billion, $6.4 billion, $5.7 billion, $4.4 billion and $1.7 billion at December 31, 2014, 2013, 2012, 2011 and 2010, respectively.
(5) Includes U.S. small business commercial loans, including card-related products, of $13.3 billion, $13.3 billion, $12.6 billion, $13.3 billion and $14.7 billion at December 31, 2014, 2013, 2012,
2011 and 2010, respectively.
(6) Includes U.S. commercial real estate loans of $45.2 billion, $46.3 billion, $37.2 billion, $37.8 billion and $46.9 billion, and non-U.S. commercial real estate loans of $2.5 billion, $1.6 billion, $1.5
billion, $1.8 billion and $2.5 billion at December 31, 2014, 2013, 2012, 2011 and 2010, respectively.