Bank of America 2014 Annual Report Download - page 133
Download and view the complete annual report
Please find page 133 of the 2014 Bank of America annual report below. You can navigate through the pages in the report by either clicking on the pages listed below, or by using the keyword search tool below to find specific information within the annual report.-
 1
1 -
2
-
3
-
4
-
5
-
6
-
7
-
8
-
9
-
10
-
11
-
12
-
13
-
14
-
15
-
16
-
17
-
18
-
19
-
20
-
21
-
22
-
23
-
24
-
25
-
26
-
27
-
28
-
29
-
30
-
31
-
32
-
33
-
34
-
35
-
36
-
37
-
38
-
39
-
40
-
41
-
42
-
43
-
44
-
45
-
46
-
47
-
48
-
49
-
50
-
51
-
52
-
53
-
54
-
55
-
56
-
57
-
58
-
59
-
60
-
61
-
62
-
63
-
64
-
65
-
66
-
67
-
68
-
69
-
70
-
71
-
72
-
73
-
74
-
75
-
76
-
77
-
78
-
79
-
80
-
81
-
82
-
83
-
84
-
85
-
86
-
87
-
88
-
89
-
90
-
91
-
92
-
93
-
94
-
95
-
96
-
97
-
98
-
99
-
100
-
101
-
102
-
103
-
104
-
105
-
106
-
107
-
108
-
109
-
110
-
111
-
112
-
113
-
114
-
115
-
116
-
117
-
118
-
119
-
120
-
121
-
122
-
 123
123 -
 124
124 -
 125
125 -
 126
126 -
 127
127 -
 128
128 -
 129
129 -
 130
130 -
 131
131 -
 132
132 -
 133
133 -
 134
134 -
 135
135 -
 136
136 -
 137
137 -
 138
138 -
 139
139 -
 140
140 -
 141
141 -
 142
142 -
 143
143 -
144
-
145
-
146
-
147
-
148
-
149
-
150
-
151
-
152
-
153
-
154
-
155
-
156
-
157
-
158
-
159
-
160
-
161
-
162
-
163
-
164
-
165
-
166
-
167
-
168
-
169
-
170
-
171
-
172
-
173
-
174
-
175
-
176
-
177
-
178
-
179
-
180
-
181
-
182
-
183
-
184
-
185
-
186
-
187
-
188
-
189
-
190
-
191
-
192
-
193
-
194
-
195
-
196
-
197
-
198
-
199
-
200
-
201
-
202
-
203
-
204
-
205
-
206
-
207
-
208
-
209
-
210
-
211
-
212
-
213
-
214
-
215
-
216
-
217
-
218
-
219
-
220
-
221
-
222
-
223
-
224
-
225
-
226
-
227
-
228
-
229
-
230
-
231
-
232
-
233
-
234
-
235
-
236
-
237
-
238
-
239
-
240
-
241
-
242
-
243
-
244
-
245
-
246
-
247
-
248
-
249
-
250
-
251
-
252
-
253
-
254
-
255
-
256
-
257
-
258
-
259
-
260
-
261
-
262
-
263
-
264
-
265
-
266
-
267
-
268
-
269
-
270
-
271
-
272
 |
 |

Bank of America 2014 131
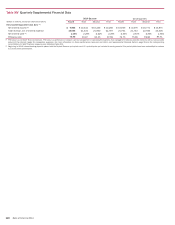
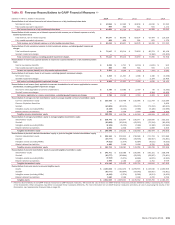
Table XV Five-year Reconciliations to GAAP Financial Measures (1)
(Dollars in millions, shares in thousands) 2014 2013 2012 2011 2010
Reconciliation of net interest income to net interest income on a fully taxable-equivalent basis
Net interest income $ 39,952 $ 42,265 $ 40,656 $ 44,616 $51,523
Fully taxable-equivalent adjustment 869 859 901 972 1,170
Net interest income on a fully taxable-equivalent basis $ 40,821 $ 43,124 $ 41,557 $ 45,588 $52,693
Reconciliation of total revenue, net of interest expense to total revenue, net of interest expense on a fully
taxable-equivalent basis
Total revenue, net of interest expense $ 84,247 $ 88,942 $ 83,334 $ 93,454 $110,220
Fully taxable-equivalent adjustment 869 859 901 972 1,170
Total revenue, net of interest expense on a fully taxable-equivalent basis $ 85,116 $ 89,801 $ 84,235 $ 94,426 $111,390
Reconciliation of total noninterest expense to total noninterest expense, excluding goodwill impairment
charges
Total noninterest expense $ 75,117 $ 69,214 $ 72,093 $ 80,274 $83,108
Goodwill impairment charges —— — (3,184) (12,400)
Total noninterest expense, excluding goodwill impairment charges $ 75,117 $ 69,214 $ 72,093 $ 77,090 $70,708
Reconciliation of income tax expense (benefit) to income tax expense (benefit) on a fully taxable-equivalent
basis
Income tax expense (benefit) $ 2,022 $ 4,741 $ (1,116) $ (1,676) $ 915
Fully taxable-equivalent adjustment 869 859 901 972 1,170
Income tax expense (benefit) on a fully taxable-equivalent basis $ 2,891 $ 5,600 $ (215) $ (704) $ 2,085
Reconciliation of net income (loss) to net income, excluding goodwill impairment charges
Net income (loss) $ 4,833 $ 11,431 $ 4,188 $ 1,446 $ (2,238)
Goodwill impairment charges —— — 3,184 12,400
Net income, excluding goodwill impairment charges $ 4,833 $ 11,431 $ 4,188 $ 4,630 $ 10,162
Reconciliation of net income (loss) applicable to common shareholders to net income applicable to common
shareholders, excluding goodwill impairment charges
Net income (loss) applicable to common shareholders $ 3,789 $ 10,082 $ 2,760 $ 85 $ (3,595)
Goodwill impairment charges —— — 3,184 12,400
Net income applicable to common shareholders, excluding goodwill impairment charges $ 3,789 $ 10,082 $ 2,760 $ 3,269 $ 8,805
Reconciliation of average common shareholders’ equity to average tangible common shareholders’ equity
Common shareholders’ equity $ 223,066 $ 218,468 $ 216,996 $ 211,709 $ 212,686
Common Equivalent Securities ————
2,900
Goodwill (69,809) (69,910) (69,974) (72,334) (82,600)
Intangible assets (excluding MSRs) (5,109) (6,132) (7,366) (9,180) (10,985)
Related deferred tax liabilities 2,090 2,328 2,593 2,898 3,306
Tangible common shareholders’ equity $ 150,238 $ 144,754 $ 142,249 $ 133,093 $ 125,307
Reconciliation of average shareholders’ equity to average tangible shareholders’ equity
Shareholders’ equity $ 238,476 $ 233,947 $ 235,677 $ 229,095 $ 233,235
Goodwill (69,809) (69,910) (69,974) (72,334) (82,600)
Intangible assets (excluding MSRs) (5,109) (6,132) (7,366) (9,180) (10,985)
Related deferred tax liabilities 2,090 2,328 2,593 2,898 3,306
Tangible shareholders’ equity $ 165,648 $ 160,233 $ 160,930 $ 150,479 $ 142,956
Reconciliation of year-end common shareholders’ equity to year-end tangible common shareholders’ equity
Common shareholders’ equity $ 224,162 $ 219,333 $ 218,188 $ 211,704 $ 211,686
Goodwill (69,777) (69,844) (69,976) (69,967) (73,861)
Intangible assets (excluding MSRs) (4,612) (5,574) (6,684) (8,021) (9,923)
Related deferred tax liabilities 1,960 2,166 2,428 2,702 3,036
Tangible common shareholders’ equity $ 151,733 $ 146,081 $ 143,956 $ 136,418 $ 130,938
Reconciliation of year-end shareholders’ equity to year-end tangible shareholders’ equity
Shareholders’ equity $ 243,471 $ 232,685 $ 236,956 $ 230,101 $ 228,248
Goodwill (69,777) (69,844) (69,976) (69,967) (73,861)
Intangible assets (excluding MSRs) (4,612) (5,574) (6,684) (8,021) (9,923)
Related deferred tax liabilities 1,960 2,166 2,428 2,702 3,036
Tangible shareholders’ equity $ 171,042 $ 159,433 $ 162,724 $ 154,815 $ 147,500
Reconciliation of year-end assets to year-end tangible assets
Assets $ 2,104,534 $ 2,102,273 $ 2,209,974 $ 2,129,046 $2,264,909
Goodwill (69,777) (69,844) (69,976) (69,967) (73,861)
Intangible assets (excluding MSRs) (4,612) (5,574) (6,684) (8,021) (9,923)
Related deferred tax liabilities 1,960 2,166 2,428 2,702 3,036
Tangible assets $ 2,032,105 $ 2,029,021 $ 2,135,742 $ 2,053,760 $2,184,161
(1) Presents reconciliations of non-GAAP financial measures to GAAP financial measures. We believe the use of these non-GAAP financial measures provides additional clarity in assessing the results
of the Corporation. Other companies may define or calculate these measures differently. For more information on non-GAAP financial measures and ratios we use in assessing the results of the
Corporation, see Supplemental Financial Data on page 29.