Bank of America 2014 Annual Report Download - page 238
Download and view the complete annual report
Please find page 238 of the 2014 Bank of America annual report below. You can navigate through the pages in the report by either clicking on the pages listed below, or by using the keyword search tool below to find specific information within the annual report.-
 1
1 -
2
-
3
-
4
-
5
-
6
-
7
-
8
-
9
-
10
-
11
-
12
-
13
-
14
-
15
-
16
-
17
-
18
-
19
-
20
-
21
-
22
-
23
-
24
-
25
-
26
-
27
-
28
-
29
-
30
-
31
-
32
-
33
-
34
-
35
-
36
-
37
-
38
-
39
-
40
-
41
-
42
-
43
-
44
-
45
-
46
-
47
-
48
-
49
-
50
-
51
-
52
-
53
-
54
-
55
-
56
-
57
-
58
-
59
-
60
-
61
-
62
-
63
-
64
-
65
-
66
-
67
-
68
-
69
-
70
-
71
-
72
-
73
-
74
-
75
-
76
-
77
-
78
-
79
-
80
-
81
-
82
-
83
-
84
-
85
-
86
-
87
-
88
-
89
-
90
-
91
-
92
-
93
-
94
-
95
-
96
-
97
-
98
-
99
-
100
-
101
-
102
-
103
-
104
-
105
-
106
-
107
-
108
-
109
-
110
-
111
-
112
-
113
-
114
-
115
-
116
-
117
-
118
-
119
-
120
-
121
-
122
-
123
-
124
-
125
-
126
-
127
-
128
-
129
-
130
-
131
-
132
-
133
-
134
-
135
-
136
-
137
-
138
-
139
-
140
-
141
-
142
-
143
-
144
-
145
-
146
-
147
-
148
-
149
-
150
-
151
-
152
-
153
-
154
-
155
-
156
-
157
-
158
-
159
-
160
-
161
-
162
-
163
-
164
-
165
-
166
-
167
-
168
-
169
-
170
-
171
-
172
-
173
-
174
-
175
-
176
-
177
-
178
-
179
-
180
-
181
-
182
-
183
-
184
-
185
-
186
-
187
-
188
-
189
-
190
-
191
-
192
-
193
-
194
-
195
-
196
-
197
-
198
-
199
-
200
-
201
-
202
-
203
-
204
-
205
-
206
-
207
-
208
-
209
-
210
-
211
-
212
-
213
-
214
-
215
-
216
-
217
-
218
-
219
-
220
-
221
-
222
-
223
-
224
-
225
-
226
-
227
-
 228
228 -
 229
229 -
 230
230 -
 231
231 -
 232
232 -
 233
233 -
 234
234 -
 235
235 -
 236
236 -
 237
237 -
 238
238 -
 239
239 -
 240
240 -
 241
241 -
 242
242 -
 243
243 -
 244
244 -
 245
245 -
 246
246 -
 247
247 -
 248
248 -
249
-
250
-
251
-
252
-
253
-
254
-
255
-
256
-
257
-
258
-
259
-
260
-
261
-
262
-
263
-
264
-
265
-
266
-
267
-
268
-
269
-
270
-
271
-
272
 |
 |

236 Bank of America 2014
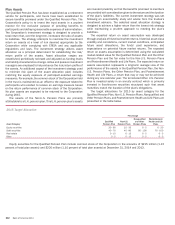
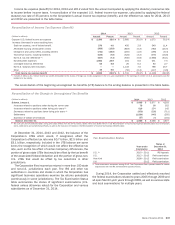
The table below presents the status at December 31, 2014 of
the cash-settled RSUs granted under the Key Associate Stock Plan
and changes during 2014.
Cash-settled Restricted Units
Units
Outstanding at January 1, 2014 359,928,869
Granted 130,956,173
Vested (162,061,256)
Canceled (11,867,351)
Outstanding at December 31, 2014 316,956,435
At December 31, 2014, there was an estimated $1.5 billion of
total unrecognized compensation cost related to certain share-
based compensation awards that is expected to be recognized
over a period of up to four years, with a weighted-average period
of 1.6 years. The total fair value of restricted stock vested in 2014,
2013 and 2012 was $576 million, $1.0 billion and $2.9 billion,
respectively. In 2014, 2013 and 2012, the amount of cash paid
to settle equity-based awards for all equity compensation plans
was $1.7 billion, $1.4 billion and $779 million, respectively.
Stock Options
The table below presents the status of all option plans at
December 31, 2014 and changes during 2014.
Stock Options
Options
Weighted-
average
Exercise Price
Outstanding at January 1, 2014 122,168,691 $ 48.23
Forfeited (34,081,637) 46.32
Outstanding at December 31, 2014 88,087,054 48.96
Options vested and exercisable at
December 31, 2014 88,087,054 48.96
Outstanding options at December 31, 2014 included 79
million options under the Key Associate Stock Plan and nine million
options to employees of predecessor company plans assumed in
mergers. All options outstanding as of December 31, 2014 were
vested and exercisable with a weighted-average remaining
contractual term of 1.6 years and have no aggregate intrinsic value.
No options have been granted since 2008.
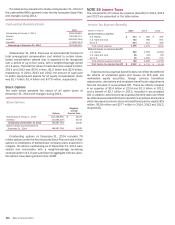
NOTE 19 Income Taxes
The components of income tax expense (benefit) for 2014, 2013
and 2012 are presented in the table below.
Income Tax Expense (Benefit)
(Dollars in millions) 2014 2013 2012
Current income tax expense
U.S. federal $ 443 $ 180 $ 458
U.S. state and local 340 786 592
Non-U.S. 513 513 569
Total current expense 1,296 1,479 1,619
Deferred income tax expense (benefit)
U.S. federal 583 2,056 (3,433)
U.S. state and local 85 (94) (55)
Non-U.S. 58 1,300 753
Total deferred expense (benefit) 726 3,262 (2,735)
Total income tax expense (benefit) $ 2,022 $ 4,741 $ (1,116)
Total income tax expense (benefit) does not reflect the deferred
tax effects of unrealized gains and losses on AFS debt and
marketable equity securities, foreign currency translation
adjustments, derivatives and employee benefit plan adjustments
that are included in accumulated OCI. These tax effects resulted
in an expense of $3.4 billion in 2014 and $1.3 billion in 2012,
and a benefit of $2.7 billion in 2013, recorded in accumulated
OCI. In addition, total income tax expense (benefit) does not reflect
tax effects associated with the Corporation’s employee stock plans
which decreased common stock and additional paid-in capital $35
million, $128 million and $277 million in 2014, 2013 and 2012,
respectively.