Bank of America 2014 Annual Report Download - page 159
Download and view the complete annual report
Please find page 159 of the 2014 Bank of America annual report below. You can navigate through the pages in the report by either clicking on the pages listed below, or by using the keyword search tool below to find specific information within the annual report.-
 1
1 -
2
-
3
-
4
-
5
-
6
-
7
-
8
-
9
-
10
-
11
-
12
-
13
-
14
-
15
-
16
-
17
-
18
-
19
-
20
-
21
-
22
-
23
-
24
-
25
-
26
-
27
-
28
-
29
-
30
-
31
-
32
-
33
-
34
-
35
-
36
-
37
-
38
-
39
-
40
-
41
-
42
-
43
-
44
-
45
-
46
-
47
-
48
-
49
-
50
-
51
-
52
-
53
-
54
-
55
-
56
-
57
-
58
-
59
-
60
-
61
-
62
-
63
-
64
-
65
-
66
-
67
-
68
-
69
-
70
-
71
-
72
-
73
-
74
-
75
-
76
-
77
-
78
-
79
-
80
-
81
-
82
-
83
-
84
-
85
-
86
-
87
-
88
-
89
-
90
-
91
-
92
-
93
-
94
-
95
-
96
-
97
-
98
-
99
-
100
-
101
-
102
-
103
-
104
-
105
-
106
-
107
-
108
-
109
-
110
-
111
-
112
-
113
-
114
-
115
-
116
-
117
-
118
-
119
-
120
-
121
-
122
-
123
-
124
-
125
-
126
-
127
-
128
-
129
-
130
-
131
-
132
-
133
-
134
-
135
-
136
-
137
-
138
-
139
-
140
-
141
-
142
-
143
-
144
-
145
-
146
-
147
-
148
-
 149
149 -
 150
150 -
 151
151 -
 152
152 -
 153
153 -
 154
154 -
 155
155 -
 156
156 -
 157
157 -
 158
158 -
 159
159 -
 160
160 -
 161
161 -
 162
162 -
 163
163 -
 164
164 -
 165
165 -
 166
166 -
 167
167 -
 168
168 -
 169
169 -
170
-
171
-
172
-
173
-
174
-
175
-
176
-
177
-
178
-
179
-
180
-
181
-
182
-
183
-
184
-
185
-
186
-
187
-
188
-
189
-
190
-
191
-
192
-
193
-
194
-
195
-
196
-
197
-
198
-
199
-
200
-
201
-
202
-
203
-
204
-
205
-
206
-
207
-
208
-
209
-
210
-
211
-
212
-
213
-
214
-
215
-
216
-
217
-
218
-
219
-
220
-
221
-
222
-
223
-
224
-
225
-
226
-
227
-
228
-
229
-
230
-
231
-
232
-
233
-
234
-
235
-
236
-
237
-
238
-
239
-
240
-
241
-
242
-
243
-
244
-
245
-
246
-
247
-
248
-
249
-
250
-
251
-
252
-
253
-
254
-
255
-
256
-
257
-
258
-
259
-
260
-
261
-
262
-
263
-
264
-
265
-
266
-
267
-
268
-
269
-
270
-
271
-
272
 |
 |

Bank of America 2014 157
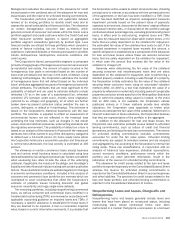
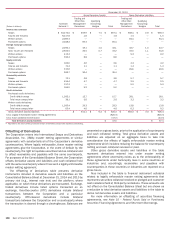
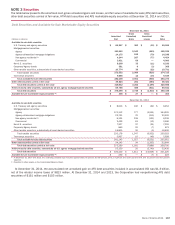
NOTE 2 Derivatives
Derivative Balances
Derivatives are entered into on behalf of customers, for trading,
or to support risk management activities. Derivatives used in risk
management activities include derivatives that may or may not be
designated in qualifying hedge accounting relationships.
Derivatives that are not designated in qualifying hedge accounting
relationships are referred to as other risk management derivatives.
For more information on the Corporation’s derivatives and hedging
activities, see Note 1 – Summary of Significant Accounting
Principles. The following tables present derivative instruments
included on the Consolidated Balance Sheet in derivative assets
and liabilities at December 31, 2014 and 2013. Balances are
presented on a gross basis, prior to the application of counterparty
and cash collateral netting. Total derivative assets and liabilities
are adjusted on an aggregate basis to take into consideration the
effects of legally enforceable master netting agreements and have
been reduced by the cash collateral received or paid.
December 31, 2014
Gross Derivative Assets Gross Derivative Liabilities
(Dollars in billions)
Contract/
Notional (1)
Trading and
Other Risk
Management
Derivatives
Qualifying
Accounting
Hedges Total
Trading and
Other Risk
Management
Derivatives
Qualifying
Accounting
Hedges Total
Interest rate contracts
Swaps $ 29,445.4 $ 658.5 $ 8.5 $ 667.0 $ 658.2 $ 0.5 $ 658.7
Futures and forwards 10,159.4 1.7 — 1.7 2.0 —2.0
Written options 1,725.2 — — — 85.4 — 85.4
Purchased options 1,739.8 85.6 — 85.6 — — —
Foreign exchange contracts
Swaps 2,159.1 51.5 0.8 52.3 54.6 1.9 56.5
Spot, futures and forwards 4,226.4 68.9 1.5 70.4 72.4 0.2 72.6
Written options 600.7 — — — 16.0 — 16.0
Purchased options 584.6 15.1 — 15.1 — — —
Equity contracts
Swaps 193.7 3.2 — 3.2 4.0 —4.0
Futures and forwards 69.5 2.1 — 2.1 1.8 —1.8
Written options 341.0 — — — 26.0 — 26.0
Purchased options 318.4 27.9 — 27.9 — — —
Commodity contracts
Swaps 74.3 5.8 — 5.8 8.5 —8.5
Futures and forwards 376.5 4.5 — 4.5 1.8 —1.8
Written options 129.5 — — — 11.5 — 11.5
Purchased options 141.3 10.7 — 10.7 — — —
Credit derivatives
Purchased credit derivatives:
Credit default swaps 1,094.8 13.3 — 13.3 23.4 — 23.4
Total return swaps/other 44.3 0.2 — 0.2 1.4 —1.4
Written credit derivatives:
Credit default swaps 1,073.1 24.5 — 24.5 11.9 — 11.9
Total return swaps/other 61.0 0.5 — 0.5 0.3 —0.3
Gross derivative assets/liabilities $ 974.0 $ 10.8 $ 984.8 $ 979.2 $ 2.6 $ 981.8
Less: Legally enforceable master netting agreements
(884.8) (884.8)
Less: Cash collateral received/paid (47.3) (50.1)
Total derivative assets/liabilities $ 52.7 $ 46.9
(1) Represents the total contract/notional amount of derivative assets and liabilities outstanding.