Bank of America 2014 Annual Report Download - page 266
Download and view the complete annual report
Please find page 266 of the 2014 Bank of America annual report below. You can navigate through the pages in the report by either clicking on the pages listed below, or by using the keyword search tool below to find specific information within the annual report.-
 1
1 -
2
-
3
-
4
-
5
-
6
-
7
-
8
-
9
-
10
-
11
-
12
-
13
-
14
-
15
-
16
-
17
-
18
-
19
-
20
-
21
-
22
-
23
-
24
-
25
-
26
-
27
-
28
-
29
-
30
-
31
-
32
-
33
-
34
-
35
-
36
-
37
-
38
-
39
-
40
-
41
-
42
-
43
-
44
-
45
-
46
-
47
-
48
-
49
-
50
-
51
-
52
-
53
-
54
-
55
-
56
-
57
-
58
-
59
-
60
-
61
-
62
-
63
-
64
-
65
-
66
-
67
-
68
-
69
-
70
-
71
-
72
-
73
-
74
-
75
-
76
-
77
-
78
-
79
-
80
-
81
-
82
-
83
-
84
-
85
-
86
-
87
-
88
-
89
-
90
-
91
-
92
-
93
-
94
-
95
-
96
-
97
-
98
-
99
-
100
-
101
-
102
-
103
-
104
-
105
-
106
-
107
-
108
-
109
-
110
-
111
-
112
-
113
-
114
-
115
-
116
-
117
-
118
-
119
-
120
-
121
-
122
-
123
-
124
-
125
-
126
-
127
-
128
-
129
-
130
-
131
-
132
-
133
-
134
-
135
-
136
-
137
-
138
-
139
-
140
-
141
-
142
-
143
-
144
-
145
-
146
-
147
-
148
-
149
-
150
-
151
-
152
-
153
-
154
-
155
-
156
-
157
-
158
-
159
-
160
-
161
-
162
-
163
-
164
-
165
-
166
-
167
-
168
-
169
-
170
-
171
-
172
-
173
-
174
-
175
-
176
-
177
-
178
-
179
-
180
-
181
-
182
-
183
-
184
-
185
-
186
-
187
-
188
-
189
-
190
-
191
-
192
-
193
-
194
-
195
-
196
-
197
-
198
-
199
-
200
-
201
-
202
-
203
-
204
-
205
-
206
-
207
-
208
-
209
-
210
-
211
-
212
-
213
-
214
-
215
-
216
-
217
-
218
-
219
-
220
-
221
-
222
-
223
-
224
-
225
-
226
-
227
-
228
-
229
-
230
-
231
-
232
-
233
-
234
-
235
-
236
-
237
-
238
-
239
-
240
-
241
-
242
-
243
-
244
-
245
-
246
-
247
-
248
-
249
-
250
-
251
-
252
-
253
-
254
-
255
-
 256
256 -
 257
257 -
 258
258 -
 259
259 -
 260
260 -
 261
261 -
 262
262 -
 263
263 -
 264
264 -
 265
265 -
 266
266 -
 267
267 -
 268
268 -
 269
269 -
 270
270 -
 271
271 -
 272
272
 |
 |

264 Bank of America 2014
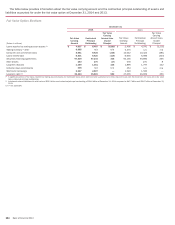
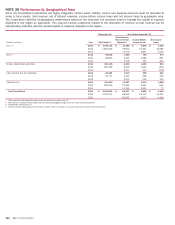
NOTE 26 Performance by Geographical Area
Since the Corporation’s operations are highly integrated, certain asset, liability, income and expense amounts must be allocated to
arrive at total assets, total revenue, net of interest expense, income before income taxes and net income (loss) by geographic area.
The Corporation identifies its geographic performance based on the business unit structure used to manage the capital or expense
deployed in the region as applicable. This requires certain judgments related to the allocation of revenue so that revenue can be
appropriately matched with the related capital or expense deployed in the region.
December 31 Year Ended December 31
(Dollars in millions) Year Total Assets (1)
Total Revenue,
Net of Interest
Expense (2)
Income Before
Income Taxes
Net Income
(Loss)
U.S. (3) 2014 $ 1,792,719 $ 72,960 $ 4,643 $ 3,305
2013 1,803,243 76,612 13,221 10,588
2012 72,175 1,867 4,116
Asia (4) 2014 92,005 3,605 759 473
2013 98,605 4,442 1,382 887
2012 3,478 353 282
Europe, Middle East and Africa 2014 190,365 6,409 1,098 813
2013 169,708 6,353 1,003 (403)
2012 6,011 323 (543)
Latin America and the Caribbean 2014 29,445 1,273 355 242
2013 30,717 1,535 566 359
2012 1,670 529 333
Total Non-U.S. 2014 311,815 11,287 2,212 1,528
2013 299,030 12,330 2,951 843
2012 11,159 1,205 72
Total Consolidated 2014 $ 2,104,534 $ 84,247 $ 6,855 $ 4,833
2013 2,102,273 88,942 16,172 11,431
2012 83,334 3,072 4,188
(1) Total assets include long-lived assets, which are primarily located in the U.S.
(2) There were no material intercompany revenues between geographic regions for any of the periods presented.
(3) Substantially reflects the U.S.
(4) Amounts include pretax gains of $753 million ($474 million net-of-tax) on the sale of common shares of CCB during 2013.