Bank of America 2014 Annual Report Download - page 104
Download and view the complete annual report
Please find page 104 of the 2014 Bank of America annual report below. You can navigate through the pages in the report by either clicking on the pages listed below, or by using the keyword search tool below to find specific information within the annual report.-
 1
1 -
2
-
3
-
4
-
5
-
6
-
7
-
8
-
9
-
10
-
11
-
12
-
13
-
14
-
15
-
16
-
17
-
18
-
19
-
20
-
21
-
22
-
23
-
24
-
25
-
26
-
27
-
28
-
29
-
30
-
31
-
32
-
33
-
34
-
35
-
36
-
37
-
38
-
39
-
40
-
41
-
42
-
43
-
44
-
45
-
46
-
47
-
48
-
49
-
50
-
51
-
52
-
53
-
54
-
55
-
56
-
57
-
58
-
59
-
60
-
61
-
62
-
63
-
64
-
65
-
66
-
67
-
68
-
69
-
70
-
71
-
72
-
73
-
74
-
75
-
76
-
77
-
78
-
79
-
80
-
81
-
82
-
83
-
84
-
85
-
86
-
87
-
88
-
89
-
90
-
91
-
92
-
93
-
 94
94 -
 95
95 -
 96
96 -
 97
97 -
 98
98 -
 99
99 -
 100
100 -
 101
101 -
 102
102 -
 103
103 -
 104
104 -
 105
105 -
 106
106 -
 107
107 -
 108
108 -
 109
109 -
 110
110 -
 111
111 -
 112
112 -
 113
113 -
 114
114 -
115
-
116
-
117
-
118
-
119
-
120
-
121
-
122
-
123
-
124
-
125
-
126
-
127
-
128
-
129
-
130
-
131
-
132
-
133
-
134
-
135
-
136
-
137
-
138
-
139
-
140
-
141
-
142
-
143
-
144
-
145
-
146
-
147
-
148
-
149
-
150
-
151
-
152
-
153
-
154
-
155
-
156
-
157
-
158
-
159
-
160
-
161
-
162
-
163
-
164
-
165
-
166
-
167
-
168
-
169
-
170
-
171
-
172
-
173
-
174
-
175
-
176
-
177
-
178
-
179
-
180
-
181
-
182
-
183
-
184
-
185
-
186
-
187
-
188
-
189
-
190
-
191
-
192
-
193
-
194
-
195
-
196
-
197
-
198
-
199
-
200
-
201
-
202
-
203
-
204
-
205
-
206
-
207
-
208
-
209
-
210
-
211
-
212
-
213
-
214
-
215
-
216
-
217
-
218
-
219
-
220
-
221
-
222
-
223
-
224
-
225
-
226
-
227
-
228
-
229
-
230
-
231
-
232
-
233
-
234
-
235
-
236
-
237
-
238
-
239
-
240
-
241
-
242
-
243
-
244
-
245
-
246
-
247
-
248
-
249
-
250
-
251
-
252
-
253
-
254
-
255
-
256
-
257
-
258
-
259
-
260
-
261
-
262
-
263
-
264
-
265
-
266
-
267
-
268
-
269
-
270
-
271
-
272
 |
 |

102 Bank of America 2014
Interest Rate Risk Management for Nontrading
Activities
The following discussion presents net interest income excluding
the impact of trading-related activities.
Interest rate risk represents the most significant market risk
exposure to our non-trading balance sheet. Interest rate risk is
measured as the potential change in net interest income caused
by movements in market interest rates. Client-facing activities,
primarily lending and deposit-taking, create interest rate sensitive
positions on our balance sheet.
We prepare forward-looking forecasts of net interest income.
The baseline forecast takes into consideration expected future
business growth, ALM positioning and the direction of interest rate
movements as implied by the market-based forward curve. We
then measure and evaluate the impact that alternative interest
rate scenarios have on the baseline forecast in order to assess
interest rate sensitivity under varied conditions. The net interest
income forecast is frequently updated for changing assumptions
and differing outlooks based on economic trends, market
conditions and business strategies. Thus, we continually monitor
our balance sheet position in order to maintain an acceptable level
of exposure to interest rate changes.
The interest rate scenarios that we analyze incorporate balance
sheet assumptions such as loan and deposit growth and pricing,
changes in funding mix, product repricing and maturity
characteristics. Our overall goal is to manage interest rate risk so
that movements in interest rates do not significantly adversely
affect earnings and capital.
Table 63 presents the spot and 12-month forward rates used
in our baseline forecasts at December 31, 2014 and 2013.
Table 63 Forward Rates
December 31, 2014
Federal
Funds
Three-
Month
LIBOR
10-Year
Swap
Spot rates 0.25% 0.26% 2.28%
12-month forward rates 0.75 0.91 2.55
December 31, 2013
Spot rates 0.25% 0.25% 3.09%
12-month forward rates 0.25 0.43 3.52
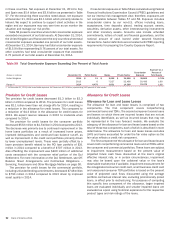
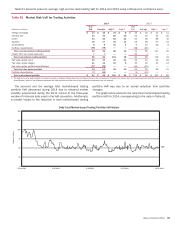
Table 64 shows the pretax dollar impact to forecasted net
interest income over the next 12 months from December 31, 2014
and 2013, resulting from instantaneous parallel and non-parallel
shocks to the market-based forward curve. Periodically, we
evaluate the scenarios presented to ensure that they are
meaningful in the context of the current rate environment. For more
information on net interest income excluding the impact of trading-
related activities, see page 30.
We continue to be asset-sensitive to both a parallel move in
interest rates and a long-end led steepening of the yield curve.
Additionally, rising interest rates impact the fair value of debt
securities and, accordingly, for debt securities classified as AFS,
may adversely affect accumulated OCI and thus capital levels
under the Basel 3 capital rules. Under instantaneous upward
parallel shifts, the near term adverse impact to accumulated OCI
and Basel 3 capital is reduced over time by offsetting positive
impacts to net interest income. For more information on the phase-
in provisions of Basel 3 including accumulated OCI, see Capital
Management – Regulatory Capital on page 56.
Table 64 Estimated Net Interest Income Excluding
Trading-related Net Interest Income
(Dollars in millions) Short
Rate (bps)
Long
Rate (bps)
December 31
Curve Change 2014 2013
Parallel Shifts
+100 bps
instantaneous shift +100 +100 $ 3,685 $ 3,229
-50 bps
instantaneous shift -50 -50 (3,043) (1,616)
Flatteners
Short-end
instantaneous change +100 — 1,966 2,210
Long-end
instantaneous change — -50 (1,772) (641)
Steepeners
Short-end
instantaneous change -50 — (1,261) (937)
Long-end
instantaneous change — +100 1,782 1,066
The sensitivity analysis in Table 64 assumes that we take no
action in response to these rate shocks and does not assume any
change in other macroeconomic variables normally correlated with
changes in interest rates. As part of our ALM activities, we use
securities, residential mortgages, and interest rate and foreign
exchange derivatives in managing interest rate sensitivity.
The behavior of our deposit portfolio in the baseline forecast
and in alternate interest rate scenarios is a key assumption in our
projected estimates of net interest income. The sensitivity analysis
in Table 64 assumes no change in deposit portfolio size or mix
from the baseline forecast in alternate rate environments. In higher
rate scenarios, any customer activity resulting in the replacement
of low-cost or noninterest-bearing deposits with higher-yielding
deposits or market-based funding would reduce the Corporation’s
benefit in those scenarios.