Bank of America 2014 Annual Report Download - page 103
Download and view the complete annual report
Please find page 103 of the 2014 Bank of America annual report below. You can navigate through the pages in the report by either clicking on the pages listed below, or by using the keyword search tool below to find specific information within the annual report.-
 1
1 -
2
-
3
-
4
-
5
-
6
-
7
-
8
-
9
-
10
-
11
-
12
-
13
-
14
-
15
-
16
-
17
-
18
-
19
-
20
-
21
-
22
-
23
-
24
-
25
-
26
-
27
-
28
-
29
-
30
-
31
-
32
-
33
-
34
-
35
-
36
-
37
-
38
-
39
-
40
-
41
-
42
-
43
-
44
-
45
-
46
-
47
-
48
-
49
-
50
-
51
-
52
-
53
-
54
-
55
-
56
-
57
-
58
-
59
-
60
-
61
-
62
-
63
-
64
-
65
-
66
-
67
-
68
-
69
-
70
-
71
-
72
-
73
-
74
-
75
-
76
-
77
-
78
-
79
-
80
-
81
-
82
-
83
-
84
-
85
-
86
-
87
-
88
-
89
-
90
-
91
-
92
-
 93
93 -
 94
94 -
 95
95 -
 96
96 -
 97
97 -
 98
98 -
 99
99 -
 100
100 -
 101
101 -
 102
102 -
 103
103 -
 104
104 -
 105
105 -
 106
106 -
 107
107 -
 108
108 -
 109
109 -
 110
110 -
 111
111 -
 112
112 -
 113
113 -
114
-
115
-
116
-
117
-
118
-
119
-
120
-
121
-
122
-
123
-
124
-
125
-
126
-
127
-
128
-
129
-
130
-
131
-
132
-
133
-
134
-
135
-
136
-
137
-
138
-
139
-
140
-
141
-
142
-
143
-
144
-
145
-
146
-
147
-
148
-
149
-
150
-
151
-
152
-
153
-
154
-
155
-
156
-
157
-
158
-
159
-
160
-
161
-
162
-
163
-
164
-
165
-
166
-
167
-
168
-
169
-
170
-
171
-
172
-
173
-
174
-
175
-
176
-
177
-
178
-
179
-
180
-
181
-
182
-
183
-
184
-
185
-
186
-
187
-
188
-
189
-
190
-
191
-
192
-
193
-
194
-
195
-
196
-
197
-
198
-
199
-
200
-
201
-
202
-
203
-
204
-
205
-
206
-
207
-
208
-
209
-
210
-
211
-
212
-
213
-
214
-
215
-
216
-
217
-
218
-
219
-
220
-
221
-
222
-
223
-
224
-
225
-
226
-
227
-
228
-
229
-
230
-
231
-
232
-
233
-
234
-
235
-
236
-
237
-
238
-
239
-
240
-
241
-
242
-
243
-
244
-
245
-
246
-
247
-
248
-
249
-
250
-
251
-
252
-
253
-
254
-
255
-
256
-
257
-
258
-
259
-
260
-
261
-
262
-
263
-
264
-
265
-
266
-
267
-
268
-
269
-
270
-
271
-
272
 |
 |
Bank of America 2014 101
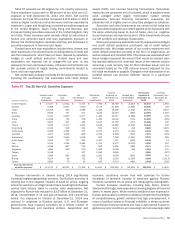
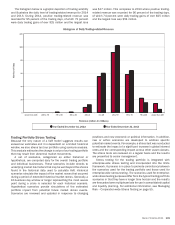
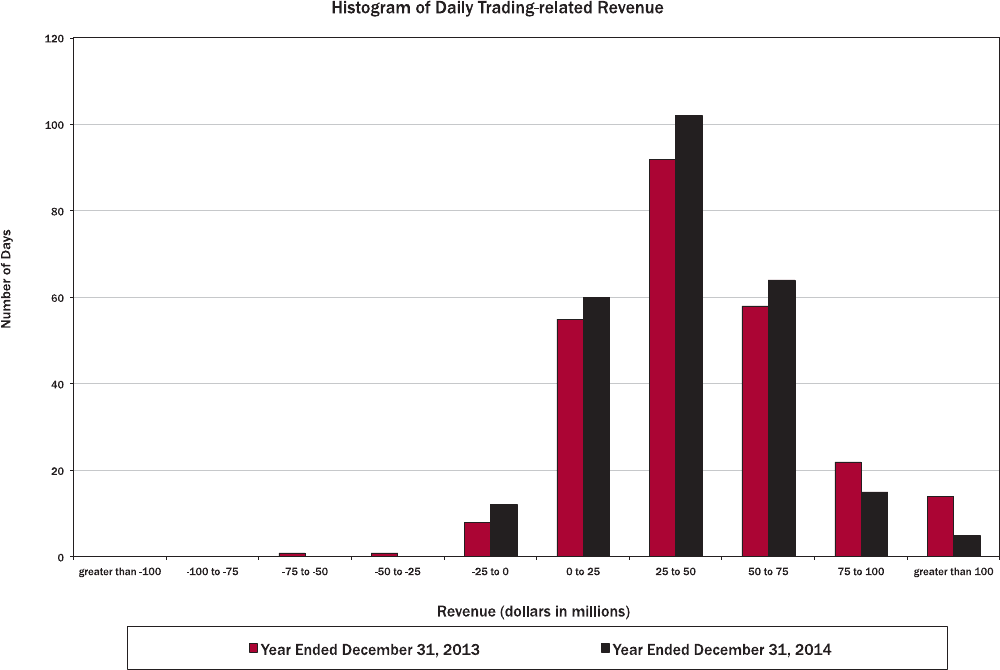
The histogram below is a graphic depiction of trading volatility
and illustrates the daily level of trading-related revenue for 2014
and 2013. During 2014, positive trading-related revenue was
recorded for 95 percent of the trading days, of which 72 percent
were daily trading gains of over $25 million and the largest loss
was $17 million. This compares to 2013 where positive trading-
related revenue was recorded for 96 percent of the trading days,
of which 74 percent were daily trading gains of over $25 million
and the largest loss was $54 million.
Trading Portfolio Stress Testing
Because the very nature of a VaR model suggests results can
exceed our estimates and it is dependent on a limited historical
window, we also stress test our portfolio using scenario analysis.
This analysis estimates the change in value of our trading portfolio
that may result from abnormal market movements.
A set of scenarios, categorized as either historical or
hypothetical, are computed daily for the overall trading portfolio
and individual businesses. These scenarios include shocks to
underlying market risk factors that may be well beyond the shocks
found in the historical data used to calculate VaR. Historical
scenarios simulate the impact of the market moves that occurred
during a period of extended historical market stress. Generally, a
10-business day window or longer representing the most severe
point during a crisis is selected for each historical scenario.
Hypothetical scenarios provide simulations of the estimated
portfolio impact from potential future market stress events.
Scenarios are reviewed and updated in response to changing
positions and new economic or political information. In addition,
new or adhoc scenarios are developed to address specific
potential market events. For example, a stress test was conducted
to estimate the impact of a significant increase in global interest
rates and the corresponding impact across other asset classes.
The stress tests are reviewed on a regular basis and the results
are presented to senior management.
Stress testing for the trading portfolio is integrated with
enterprise-wide stress testing and incorporated into the limits
framework. A process is in place to promote consistency between
the scenarios used for the trading portfolio and those used for
enterprise-wide stress testing. The scenarios used for enterprise-
wide stress testing purposes differ from the typical trading portfolio
scenarios in that they have a longer time horizon and the results
are forecasted over multiple periods for use in consolidated capital
and liquidity planning. For additional information, see Managing
Risk – Corporation-wide Stress Testing on page 55.