Bank of America 2014 Annual Report Download - page 178
Download and view the complete annual report
Please find page 178 of the 2014 Bank of America annual report below. You can navigate through the pages in the report by either clicking on the pages listed below, or by using the keyword search tool below to find specific information within the annual report.-
 1
1 -
2
-
3
-
4
-
5
-
6
-
7
-
8
-
9
-
10
-
11
-
12
-
13
-
14
-
15
-
16
-
17
-
18
-
19
-
20
-
21
-
22
-
23
-
24
-
25
-
26
-
27
-
28
-
29
-
30
-
31
-
32
-
33
-
34
-
35
-
36
-
37
-
38
-
39
-
40
-
41
-
42
-
43
-
44
-
45
-
46
-
47
-
48
-
49
-
50
-
51
-
52
-
53
-
54
-
55
-
56
-
57
-
58
-
59
-
60
-
61
-
62
-
63
-
64
-
65
-
66
-
67
-
68
-
69
-
70
-
71
-
72
-
73
-
74
-
75
-
76
-
77
-
78
-
79
-
80
-
81
-
82
-
83
-
84
-
85
-
86
-
87
-
88
-
89
-
90
-
91
-
92
-
93
-
94
-
95
-
96
-
97
-
98
-
99
-
100
-
101
-
102
-
103
-
104
-
105
-
106
-
107
-
108
-
109
-
110
-
111
-
112
-
113
-
114
-
115
-
116
-
117
-
118
-
119
-
120
-
121
-
122
-
123
-
124
-
125
-
126
-
127
-
128
-
129
-
130
-
131
-
132
-
133
-
134
-
135
-
136
-
137
-
138
-
139
-
140
-
141
-
142
-
143
-
144
-
145
-
146
-
147
-
148
-
149
-
150
-
151
-
152
-
153
-
154
-
155
-
156
-
157
-
158
-
159
-
160
-
161
-
162
-
163
-
164
-
165
-
166
-
167
-
 168
168 -
 169
169 -
 170
170 -
 171
171 -
 172
172 -
 173
173 -
 174
174 -
 175
175 -
 176
176 -
 177
177 -
 178
178 -
 179
179 -
 180
180 -
 181
181 -
 182
182 -
 183
183 -
 184
184 -
 185
185 -
 186
186 -
 187
187 -
 188
188 -
189
-
190
-
191
-
192
-
193
-
194
-
195
-
196
-
197
-
198
-
199
-
200
-
201
-
202
-
203
-
204
-
205
-
206
-
207
-
208
-
209
-
210
-
211
-
212
-
213
-
214
-
215
-
216
-
217
-
218
-
219
-
220
-
221
-
222
-
223
-
224
-
225
-
226
-
227
-
228
-
229
-
230
-
231
-
232
-
233
-
234
-
235
-
236
-
237
-
238
-
239
-
240
-
241
-
242
-
243
-
244
-
245
-
246
-
247
-
248
-
249
-
250
-
251
-
252
-
253
-
254
-
255
-
256
-
257
-
258
-
259
-
260
-
261
-
262
-
263
-
264
-
265
-
266
-
267
-
268
-
269
-
270
-
271
-
272
 |
 |

176 Bank of America 2014
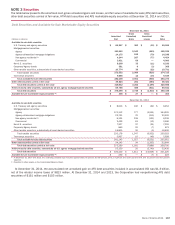
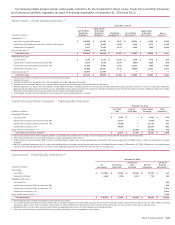
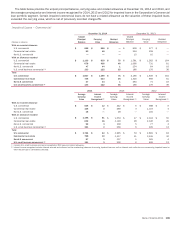
Home Loans – Credit Quality Indicators (1)
December 31, 2013
(Dollars in millions)
Core Portfolio
Residential
Mortgage (2)
Legacy Assets
& Servicing
Residential
Mortgage (2)
Residential
Mortgage PCI (3)
Core Portfolio
Home Equity (2)
Legacy Assets
& Servicing
Home Equity (2)
Home
Equity PCI
Refreshed LTV (4, 5)
Less than or equal to 90 percent $ 94,255 $ 21,587 $ 10,605 $ 44,892 $ 17,006 $1,598
Greater than 90 percent but less than or equal to 100 percent 7,013 4,216 2,638 3,178 3,948 1,121
Greater than 100 percent 6,356 8,720 5,429 6,429 11,626 3,874
Fully-insured loans (6) 69,712 17,535 — — — —
Total home loans $ 177,336 $ 52,058 $ 18,672 $ 54,499 $ 32,580 $6,593
Refreshed FICO score
Less than 620 $ 5,334 $ 9,955 $ 9,129 $ 2,415 $ 4,259 $ 1,045
Greater than or equal to 620 and less than 680 7,164 5,276 3,349 4,211 5,133 1,172
Greater than or equal to 680 and less than 740 22,617 7,639 3,211 11,726 9,143 1,936
Greater than or equal to 740 72,509 11,653 2,983 36,147 14,045 2,440
Fully-insured loans (6) 69,712 17,535 — — — —
Total home loans $ 177,336 $ 52,058 $ 18,672 $ 54,499 $ 32,580 $6,593
(1) Excludes $2.2 billion of loans accounted for under the fair value option.
(2) Excludes PCI loans.
(3) Includes $4.0 billion of pay option loans. The Corporation no longer originates this product.
(4) Refreshed LTV percentages for PCI loans are calculated using the carrying value net of the related valuation allowance.
(5) Effective December 31, 2014, with the exception of high-value properties, underlying values for LTV ratios are primarily determined using automated valuation models. For high-value properties,
generally with an original value of $1 million or more, estimated property values are determined using the CoreLogic Case-Shiller Index. Prior-period values have been updated to reflect this change.
Previously reported values were primarily determined through an index-based approach.
(6) Credit quality indicators are not reported for fully-insured loans as principal repayment is insured.
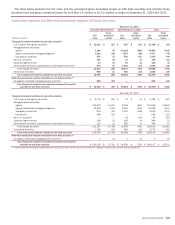
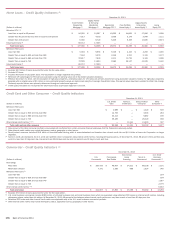
Credit Card and Other Consumer – Credit Quality Indicators
December 31, 2013
(Dollars in millions)
U.S. Credit
Card
Non-U.S.
Credit Card
Direct/Indirect
Consumer
Other
Consumer (1)
Refreshed FICO score
Less than 620 $ 4,989 $ — $ 1,220 $ 539
Greater than or equal to 620 and less than 680 12,753 — 3,345 264
Greater than or equal to 680 and less than 740 35,413 — 9,887 199
Greater than or equal to 740 39,183 — 26,220 188
Other internal credit metrics (2, 3, 4) — 11,541 41,520 787
Total credit card and other consumer $ 92,338 $ 11,541 $ 82,192 $1,977
(1) Sixty percent of the other consumer portfolio is associated with portfolios from certain consumer finance businesses that the Corporation previously exited.
(2) Other internal credit metrics may include delinquency status, geography or other factors.
(3) Direct/indirect consumer includes $35.8 billion of securities-based lending which is overcollateralized and therefore has minimal credit risk and $4.1 billion of loans the Corporation no longer
originates.
(4) Non-U.S. credit card represents the U.K. credit card portfolio which is evaluated using internal credit metrics, including delinquency status. At December 31, 2013, 98 percent of this portfolio was
current or less than 30 days past due, one percent was 30-89 days past due and one percent was 90 days or more past due.
Commercial – Credit Quality Indicators (1)
December 31, 2013
(Dollars in millions)
U.S.
Commercial
Commercial
Real Estate
Commercial
Lease
Financing
Non-U.S.
Commercial
U.S. Small
Business
Commercial (2)
Risk ratings
Pass rated $ 205,416 $ 46,507 $ 24,211 $ 88,138 $1,191
Reservable criticized 7,141 1,386 988 1,324 346
Refreshed FICO score (3)
Less than 620 224
Greater than or equal to 620 and less than 680 534
Greater than or equal to 680 and less than 740 1,567
Greater than or equal to 740 2,779
Other internal credit metrics (3, 4) 6,653
Total commercial $ 212,557 $ 47,893 $ 25,199 $ 89,462 $13,294
(1) Excludes $7.9 billion of loans accounted for under the fair value option.
(2) U.S. small business commercial includes $289 million of criticized business card and small business loans which are evaluated using refreshed FICO scores or internal credit metrics, including
delinquency status, rather than risk ratings. At December 31, 2013, 99 percent of the balances where internal credit metrics are used was current or less than 30 days past due.
(3) Refreshed FICO score and other internal credit metrics are applicable only to the U.S. small business commercial portfolio.
(4) Other internal credit metrics may include delinquency status, application scores, geography or other factors.