Bank of America 2014 Annual Report Download - page 76
Download and view the complete annual report
Please find page 76 of the 2014 Bank of America annual report below. You can navigate through the pages in the report by either clicking on the pages listed below, or by using the keyword search tool below to find specific information within the annual report.-
 1
1 -
2
-
3
-
4
-
5
-
6
-
7
-
8
-
9
-
10
-
11
-
12
-
13
-
14
-
15
-
16
-
17
-
18
-
19
-
20
-
21
-
22
-
23
-
24
-
25
-
26
-
27
-
28
-
29
-
30
-
31
-
32
-
33
-
34
-
35
-
36
-
37
-
38
-
39
-
40
-
41
-
42
-
43
-
44
-
45
-
46
-
47
-
48
-
49
-
50
-
51
-
52
-
53
-
54
-
55
-
56
-
57
-
58
-
59
-
60
-
61
-
62
-
63
-
64
-
65
-
 66
66 -
 67
67 -
 68
68 -
 69
69 -
 70
70 -
 71
71 -
 72
72 -
 73
73 -
 74
74 -
 75
75 -
 76
76 -
 77
77 -
 78
78 -
 79
79 -
 80
80 -
 81
81 -
 82
82 -
 83
83 -
 84
84 -
 85
85 -
 86
86 -
87
-
88
-
89
-
90
-
91
-
92
-
93
-
94
-
95
-
96
-
97
-
98
-
99
-
100
-
101
-
102
-
103
-
104
-
105
-
106
-
107
-
108
-
109
-
110
-
111
-
112
-
113
-
114
-
115
-
116
-
117
-
118
-
119
-
120
-
121
-
122
-
123
-
124
-
125
-
126
-
127
-
128
-
129
-
130
-
131
-
132
-
133
-
134
-
135
-
136
-
137
-
138
-
139
-
140
-
141
-
142
-
143
-
144
-
145
-
146
-
147
-
148
-
149
-
150
-
151
-
152
-
153
-
154
-
155
-
156
-
157
-
158
-
159
-
160
-
161
-
162
-
163
-
164
-
165
-
166
-
167
-
168
-
169
-
170
-
171
-
172
-
173
-
174
-
175
-
176
-
177
-
178
-
179
-
180
-
181
-
182
-
183
-
184
-
185
-
186
-
187
-
188
-
189
-
190
-
191
-
192
-
193
-
194
-
195
-
196
-
197
-
198
-
199
-
200
-
201
-
202
-
203
-
204
-
205
-
206
-
207
-
208
-
209
-
210
-
211
-
212
-
213
-
214
-
215
-
216
-
217
-
218
-
219
-
220
-
221
-
222
-
223
-
224
-
225
-
226
-
227
-
228
-
229
-
230
-
231
-
232
-
233
-
234
-
235
-
236
-
237
-
238
-
239
-
240
-
241
-
242
-
243
-
244
-
245
-
246
-
247
-
248
-
249
-
250
-
251
-
252
-
253
-
254
-
255
-
256
-
257
-
258
-
259
-
260
-
261
-
262
-
263
-
264
-
265
-
266
-
267
-
268
-
269
-
270
-
271
-
272
 |
 |
74 Bank of America 2014
Nonperforming outstanding balances in the home equity
portfolio decreased $174 million in 2014 primarily due to
enhanced identification of the delinquency status on first-lien loans
serviced by other financial institutions. This was partially offset by
an increase in contractually current nonperforming loans where
the loan has been modified in a TDR. Of the nonperforming home
equity portfolio at December 31, 2014, $1.8 billion, or 45 percent,
were current on contractual payments. Nonperforming loans that
are contractually current primarily consist of collateral-dependent
TDRs, including those that have been discharged in Chapter 7
bankruptcy, junior-lien loans where the underlying first is 90 days
or more past due, as well as loans that have not yet demonstrated
a sustained period of payment performance. In addition, $1.4
billion, or 37 percent of nonperforming home equity loans, were
180 days or more past due and had been written down to the
estimated fair value of the collateral, less costs to sell.
Outstanding balances accruing past due 30 days or more
decreased $261 million in 2014.
In some cases, the junior-lien home equity outstanding balance
that we hold is performing, but the underlying first-lien is not. For
outstanding balances in the home equity portfolio on which we
service the first-lien loan, we are able to track whether the first-
lien loan is in default. For loans where the first-lien is serviced by
a third party, we utilize credit bureau data to estimate the
delinquency status of the first-lien. Given that the credit bureau
database we use does not include a property address for the
mortgages, we are unable to identify with certainty whether a
reported delinquent first-lien mortgage pertains to the same
property for which we hold a junior-lien loan. We also utilize a third-
party vendor to combine credit bureau and public record data to
better link a junior-lien loan with the underlying first-lien mortgage.
At December 31, 2014, we estimate that $1.7 billion of current
and $217 million of 30 to 89 days past due junior-lien loans were
behind a delinquent first-lien loan. We service the first-lien loans
on $279 million of these combined amounts, with the remaining
$1.6 billion serviced by third parties. Of the $1.9 billion of current
to 89 days past due junior-lien loans, based on available credit
bureau data and our own internal servicing data, we estimate that
$800 million had first-lien loans that were 90 days or more past
due.
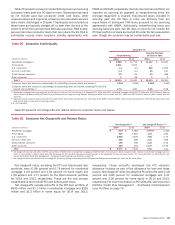
Net charge-offs decreased $896 million to $907 million, or
1.09 percent of the total average home equity portfolio in 2014,
compared to $1.8 billion, or 1.94 percent, in 2013. The decrease
in net charge-offs was primarily driven by favorable portfolio trends
due in part to improvement in home prices and the U.S. economy.
The net charge-off ratios for 2014 and 2013 were also impacted
by lower outstanding balances primarily as a result of paydowns
and charge-offs outpacing new originations and draws on existing
lines.
Outstanding balances in the home equity portfolio with greater
than 90 percent but less than or equal to 100 percent refreshed
combined loan-to-value (CLTVs) comprised seven percent and eight
percent of the home equity portfolio at December 31, 2014 and
2013. Outstanding balances with refreshed CLTVs greater than
100 percent comprised 14 percent and 21 percent of the home
equity portfolio at December 31, 2014 and 2013. Outstanding
balances in the home equity portfolio with a refreshed CLTV greater
than 100 percent reflect loans where the carrying value and
available line of credit of the combined loans are equal to or greater
than the most recent valuation of the property securing the loan.
Depending on the value of the property, there may be collateral in
excess of the first-lien that is available to reduce the severity of
loss on the second-lien. Home price deterioration since 2006,
partially mitigated by subsequent appreciation, has contributed to
an increase in CLTV ratios. Of those outstanding balances with a
refreshed CLTV greater than 100 percent, 97 percent of the
customers were current on their home equity loan and 93 percent
of second-lien loans with a refreshed CLTV greater than 100
percent were current on both their second-lien and underlying first-
lien loans at December 31, 2014. Outstanding balances in the
home equity portfolio to borrowers with a refreshed FICO score
below 620 represented seven percent and eight percent of the
home equity portfolio at December 31, 2014 and 2013.
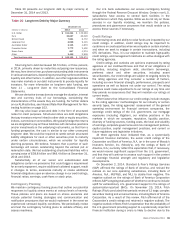
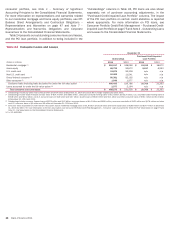
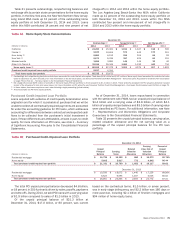
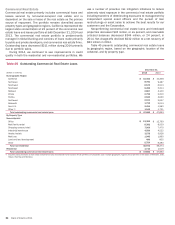
Of the $80.1 billion in total home equity portfolio outstandings
at December 31, 2014, as shown in Table 31, 75 percent were
interest-only loans, almost all of which were HELOCs. The
outstanding balance of HELOCs that have entered the amortization
period was $5.3 billion, or seven percent of total HELOCs at
December 31, 2014. The HELOCs that have entered the
amortization period have experienced a higher percentage of early
stage delinquencies and nonperforming status when compared to
the HELOC portfolio as a whole. At December 31, 2014, $135
million, or three percent of outstanding HELOCs that had entered
the amortization period were accruing past due 30 days or more
compared to $581 million, or one percent for the entire HELOC
portfolio. In addition, at December 31, 2014, $817 million, or 15
percent of outstanding HELOCs that had entered the amortization
period were nonperforming, of which $373 million were
contractually current, compared to $3.5 billion, or five percent for
the entire HELOC portfolio, of which $1.5 billion were contractually
current. Loans in our HELOC portfolio generally have an initial draw
period of 10 years and more than 75 percent of these loans that
have yet to enter the amortization period will not be required to
make a fully-amortizing payment until 2016 or later. We
communicate to contractually current customers more than a year
prior to the end of their draw period to inform them of the potential
change to the payment structure before entering the amortization
period, and provide payment options to customers prior to the end
of the draw period.
Although we do not actively track how many of our home equity
customers pay only the minimum amount due on their home equity
loans and lines, we can infer some of this information through a
review of our HELOC portfolio that we service and that is still in
its revolving period (i.e., customers may draw on and repay their
line of credit, but are generally only required to pay interest on a
monthly basis). During 2014, approximately 41 percent of these
customers with an outstanding balance did not pay any principal
on their HELOCs.