Bank of America 2014 Annual Report Download - page 74
Download and view the complete annual report
Please find page 74 of the 2014 Bank of America annual report below. You can navigate through the pages in the report by either clicking on the pages listed below, or by using the keyword search tool below to find specific information within the annual report.-
 1
1 -
2
-
3
-
4
-
5
-
6
-
7
-
8
-
9
-
10
-
11
-
12
-
13
-
14
-
15
-
16
-
17
-
18
-
19
-
20
-
21
-
22
-
23
-
24
-
25
-
26
-
27
-
28
-
29
-
30
-
31
-
32
-
33
-
34
-
35
-
36
-
37
-
38
-
39
-
40
-
41
-
42
-
43
-
44
-
45
-
46
-
47
-
48
-
49
-
50
-
51
-
52
-
53
-
54
-
55
-
56
-
57
-
58
-
59
-
60
-
61
-
62
-
63
-
 64
64 -
 65
65 -
 66
66 -
 67
67 -
 68
68 -
 69
69 -
 70
70 -
 71
71 -
 72
72 -
 73
73 -
 74
74 -
 75
75 -
 76
76 -
 77
77 -
 78
78 -
 79
79 -
 80
80 -
 81
81 -
 82
82 -
 83
83 -
 84
84 -
85
-
86
-
87
-
88
-
89
-
90
-
91
-
92
-
93
-
94
-
95
-
96
-
97
-
98
-
99
-
100
-
101
-
102
-
103
-
104
-
105
-
106
-
107
-
108
-
109
-
110
-
111
-
112
-
113
-
114
-
115
-
116
-
117
-
118
-
119
-
120
-
121
-
122
-
123
-
124
-
125
-
126
-
127
-
128
-
129
-
130
-
131
-
132
-
133
-
134
-
135
-
136
-
137
-
138
-
139
-
140
-
141
-
142
-
143
-
144
-
145
-
146
-
147
-
148
-
149
-
150
-
151
-
152
-
153
-
154
-
155
-
156
-
157
-
158
-
159
-
160
-
161
-
162
-
163
-
164
-
165
-
166
-
167
-
168
-
169
-
170
-
171
-
172
-
173
-
174
-
175
-
176
-
177
-
178
-
179
-
180
-
181
-
182
-
183
-
184
-
185
-
186
-
187
-
188
-
189
-
190
-
191
-
192
-
193
-
194
-
195
-
196
-
197
-
198
-
199
-
200
-
201
-
202
-
203
-
204
-
205
-
206
-
207
-
208
-
209
-
210
-
211
-
212
-
213
-
214
-
215
-
216
-
217
-
218
-
219
-
220
-
221
-
222
-
223
-
224
-
225
-
226
-
227
-
228
-
229
-
230
-
231
-
232
-
233
-
234
-
235
-
236
-
237
-
238
-
239
-
240
-
241
-
242
-
243
-
244
-
245
-
246
-
247
-
248
-
249
-
250
-
251
-
252
-
253
-
254
-
255
-
256
-
257
-
258
-
259
-
260
-
261
-
262
-
263
-
264
-
265
-
266
-
267
-
268
-
269
-
270
-
271
-
272
 |
 |

72 Bank of America 2014
Net charge-offs decreased $1.2 billion to a net recovery of
$114 million in 2014, or (0.08) percent of total average residential
mortgage loans, compared to net charge-offs of $1.1 billion, or
0.74 percent, in 2013. This decrease in net charge-offs was
primarily driven by favorable portfolio trends and decreased write-
downs on loans greater than 180 days past due, which were written
down to the estimated fair value of the collateral, less costs to
sell, due in part to improvement in home prices and the U.S.
economy. In addition, net charge-offs declined due to the impact
of recoveries of $407 million related to nonperforming loan sales
in 2014.
Residential mortgage loans with a greater than 90 percent but
less than or equal to 100 percent refreshed loan-to-value (LTV)
represented six percent and eight percent of the residential
mortgage portfolio at December 31, 2014 and 2013. Loans with
a refreshed LTV greater than 100 percent represented seven
percent and 11 percent of the residential mortgage loan portfolio
at December 31, 2014 and 2013. Of the loans with a refreshed
LTV greater than 100 percent, 96 percent and 95 percent were
performing at December 31, 2014 and 2013. Loans with a
refreshed LTV greater than 100 percent reflect loans where the
outstanding carrying value of the loan is greater than the most
recent valuation of the property securing the loan. The majority of
these loans have a refreshed LTV greater than 100 percent
primarily due to home price deterioration since 2006, somewhat
mitigated by subsequent appreciation. Loans to borrowers with
refreshed FICO scores below 620 represented eight percent and
11 percent of the residential mortgage portfolio at December 31,
2014 and 2013.
Of the $136.1 billion in total residential mortgage loans
outstanding at December 31, 2014, as shown in Table 29, 39
percent were originated as interest-only loans. The outstanding
balance of interest-only residential mortgage loans that have
entered the amortization period was $12.5 billion, or 23 percent
at December 31, 2014. Residential mortgage loans that have
entered the amortization period generally have experienced a
higher rate of early stage delinquencies and nonperforming status
compared to the residential mortgage portfolio as a whole. At
December 31, 2014, $256 million, or two percent of outstanding
interest-only residential mortgages that had entered the
amortization period were accruing past due 30 days or more
compared to $1.9 billion, or one percent for the entire residential
mortgage portfolio. In addition, at December 31, 2014, $862
million, or seven percent of outstanding interest-only residential
mortgages that had entered the amortization period were
nonperforming, of which $441 million were contractually current,
compared to $6.9 billion, or five percent for the entire residential
mortgage portfolio, of which $1.8 billion were contractually current.
Loans in our interest-only residential mortgage portfolio have an
interest-only period of three to ten years and more than 90 percent
of these loans that have yet to enter the amortization period will
not be required to make a fully-amortizing payment until 2016 or
later.
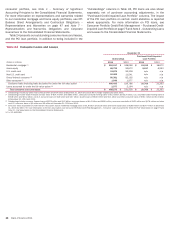
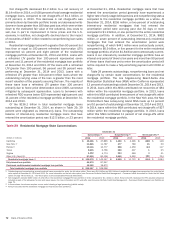
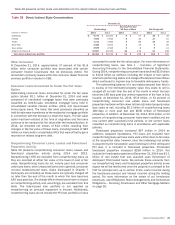
Table 29 presents outstandings, nonperforming loans and net
charge-offs by certain state concentrations for the residential
mortgage portfolio. The Los Angeles-Long Beach-Santa Ana
Metropolitan Statistical Area (MSA) within California represented
13 percent of outstandings at both December 31, 2014 and 2013.
In 2014, loans within this MSA contributed net recoveries of $81
million within the residential mortgage portfolio. In 2013, loans
within this MSA contributed three percent of net charge-offs within
the residential mortgage portfolio. In the New York area, the New
York-Northern New Jersey-Long Island MSA made up 11 percent
and 10 percent of outstandings at December 31, 2014 and 2013.
In 2014, loans within this MSA contributed net charge-offs of $27
million within the residential mortgage portfolio. In 2013, loans
within this MSA contributed 11 percent of net charge-offs within
the residential mortgage portfolio.
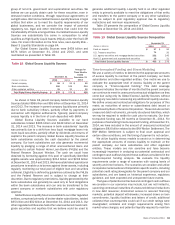
Table 29 Residential Mortgage State Concentrations
December 31
Outstandings (1) Nonperforming (1) Net Charge-offs (2)
(Dollars in millions) 2014 2013 2014 2013 2014 2013
California $ 45,496 $ 47,885 $ 1,459 $ 3,396 $(280)$ 148
New York (3) 11,826 11,787 477 789 15 59
Florida (3) 10,116 10,777 858 1,359 (43) 117
Texas 6,635 6,766 269 407 125
Virginia 4,402 4,774 244 369 431
Other U.S./Non-U.S. 57,600 60,158 3,582 5,392 189 704
Residential mortgage loans (4) $ 136,075 $142,147 $ 6,889 $ 11,712 $(114)$ 1,084
Fully-insured loan portfolio 64,970 87,247
Purchased credit-impaired residential mortgage loan portfolio 15,152 18,672
Total residential mortgage loan portfolio $ 216,197 $248,066
(1) Outstandings and nonperforming amounts exclude loans accounted for under the fair value option. There were $1.9 billion and $2.0 billion of residential mortgage loans accounted for under the fair
value option at December 31, 2014 and 2013. For more information on the fair value option, see Consumer Portfolio Credit Risk Management – Consumer Loans Accounted for Under the Fair Value
Option on page 79 and Note 21 – Fair Value Option to the Consolidated Financial Statements.
(2) Net charge-offs exclude $545 million of write-offs in the residential mortgage PCI loan portfolio in 2014 compared to $1.1 billion in 2013. These write-offs decreased the PCI valuation allowance
included as part of the allowance for loan and lease losses. For more information on PCI write-offs, see Consumer Portfolio Credit Risk Management – Purchased Credit-impaired Loan Portfolio on
page 75.
(3) In these states, foreclosure requires a court order following a legal proceeding (judicial states).
(4) Amount excludes the PCI residential mortgage and fully-insured loan portfolios.