Bank of America 2014 Annual Report Download - page 39
Download and view the complete annual report
Please find page 39 of the 2014 Bank of America annual report below. You can navigate through the pages in the report by either clicking on the pages listed below, or by using the keyword search tool below to find specific information within the annual report.-
 1
1 -
2
-
3
-
4
-
5
-
6
-
7
-
8
-
9
-
10
-
11
-
12
-
13
-
14
-
15
-
16
-
17
-
18
-
19
-
20
-
21
-
22
-
23
-
24
-
25
-
26
-
27
-
28
-
 29
29 -
 30
30 -
 31
31 -
 32
32 -
 33
33 -
 34
34 -
 35
35 -
 36
36 -
 37
37 -
 38
38 -
 39
39 -
 40
40 -
 41
41 -
 42
42 -
 43
43 -
 44
44 -
 45
45 -
 46
46 -
 47
47 -
 48
48 -
 49
49 -
50
-
51
-
52
-
53
-
54
-
55
-
56
-
57
-
58
-
59
-
60
-
61
-
62
-
63
-
64
-
65
-
66
-
67
-
68
-
69
-
70
-
71
-
72
-
73
-
74
-
75
-
76
-
77
-
78
-
79
-
80
-
81
-
82
-
83
-
84
-
85
-
86
-
87
-
88
-
89
-
90
-
91
-
92
-
93
-
94
-
95
-
96
-
97
-
98
-
99
-
100
-
101
-
102
-
103
-
104
-
105
-
106
-
107
-
108
-
109
-
110
-
111
-
112
-
113
-
114
-
115
-
116
-
117
-
118
-
119
-
120
-
121
-
122
-
123
-
124
-
125
-
126
-
127
-
128
-
129
-
130
-
131
-
132
-
133
-
134
-
135
-
136
-
137
-
138
-
139
-
140
-
141
-
142
-
143
-
144
-
145
-
146
-
147
-
148
-
149
-
150
-
151
-
152
-
153
-
154
-
155
-
156
-
157
-
158
-
159
-
160
-
161
-
162
-
163
-
164
-
165
-
166
-
167
-
168
-
169
-
170
-
171
-
172
-
173
-
174
-
175
-
176
-
177
-
178
-
179
-
180
-
181
-
182
-
183
-
184
-
185
-
186
-
187
-
188
-
189
-
190
-
191
-
192
-
193
-
194
-
195
-
196
-
197
-
198
-
199
-
200
-
201
-
202
-
203
-
204
-
205
-
206
-
207
-
208
-
209
-
210
-
211
-
212
-
213
-
214
-
215
-
216
-
217
-
218
-
219
-
220
-
221
-
222
-
223
-
224
-
225
-
226
-
227
-
228
-
229
-
230
-
231
-
232
-
233
-
234
-
235
-
236
-
237
-
238
-
239
-
240
-
241
-
242
-
243
-
244
-
245
-
246
-
247
-
248
-
249
-
250
-
251
-
252
-
253
-
254
-
255
-
256
-
257
-
258
-
259
-
260
-
261
-
262
-
263
-
264
-
265
-
266
-
267
-
268
-
269
-
270
-
271
-
272
 |
 |

Bank of America 2014 37
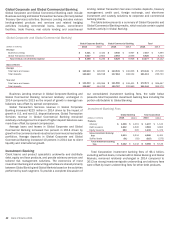
Legacy Serviced Portfolio
The Legacy Serviced Portfolio includes loans serviced by Legacy
Assets & Servicing in both the Legacy Owned Portfolio and those
loans serviced for outside investors that met the criteria as
described above. The table below summarizes the balances of the
residential mortgage loans included in the Legacy Serviced
Portfolio (the Legacy Residential Mortgage Serviced Portfolio)
representing 24 percent, 28 percent and 38 percent of the total
residential mortgage serviced portfolio of $609 billion, $719
billion and $1.2 trillion, as measured by unpaid principal balance,
at December 31, 2014, 2013 and 2012, respectively. The decline
in the Legacy Residential Mortgage Serviced Portfolio was primarily
due to MSR sales, loan sales and other servicing transfers,
paydowns and payoffs.
Legacy Residential Mortgage Serviced Portfolio, a subset
of the Residential Mortgage Serviced Portfolio (1)
December 31
(Dollars in billions) 2014 2013 2012
Unpaid principal balance
Residential mortgage loans
Total $ 148 $ 203 $ 467
60 days or more past due 25 49 137
Number of loans serviced (in thousands)
Residential mortgage loans
Total 794 1,083 2,542
60 days or more past due 135 258 649
(1) Excludes $34 billion, $39 billion and $52 billion of home equity loans and HELOCs at
December 31, 2014, 2013 and 2012, respectively.
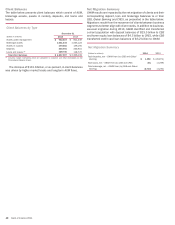
Non-Legacy Portfolio
As previously discussed, Legacy Assets & Servicing is responsible
for all of our servicing activities. The table below summarizes the
balances of the residential mortgage loans that are not included
in the Legacy Serviced Portfolio (the Non-Legacy Residential
Mortgage Serviced Portfolio) representing 76 percent, 72 percent
and 62 percent of the total residential mortgage serviced portfolio,
as measured by unpaid principal balance, at December 31, 2014,
2013 and 2012, respectively. The decline in the Non-Legacy
Residential Mortgage Serviced Portfolio was primarily due to MSR
sales and other servicing transfers, paydowns and payoffs.
Non-Legacy Residential Mortgage Serviced Portfolio, a
subset of the Residential Mortgage Serviced Portfolio (1)
December 31
(Dollars in billions) 2014 2013 2012
Unpaid principal balance
Residential mortgage loans
Total $ 461 $ 516 $ 755
60 days or more past due 912 22
Number of loans serviced (in thousands)
Residential mortgage loans
Total 2,951 3,267 4,764
60 days or more past due 54 67 124
(1) Excludes $50 billion, $52 billion and $58 billion of home equity loans and HELOCs at
December 31, 2014, 2013 and 2012, respectively.
Mortgage Banking Income
CRES mortgage banking income is categorized into production and
servicing income. Core production income is comprised primarily
of revenue from the fair value gains and losses recognized on our
interest rate lock commitments (IRLCs) and LHFS, the related
secondary market execution and costs related to representations
and warranties in the sales transactions along with other
obligations incurred in the sales of mortgage loans. Ongoing costs
related to representations and warranties and other obligations
that were incurred in the sales of mortgage loans in prior periods
are also included in production income.
Servicing income includes income earned in connection with
servicing activities and MSR valuation adjustments, net of results
from risk management activities used to hedge certain market
risks of the MSRs. The costs associated with our servicing
activities are included in noninterest expense.
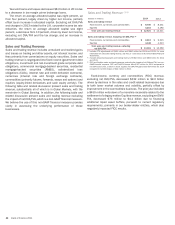
The table below summarizes the components of mortgage
banking income.
Mortgage Banking Income
(Dollars in millions) 2014 2013
Production income:
Core production revenue $ 1,181 $ 2,543
Representations and warranties provision (683) (840)
Total production income 498 1,703
Servicing income:
Servicing fees 1,884 3,030
Amortization of expected cash flows (1) (818) (1,043)
Fair value changes of MSRs, net of risk management
activities used to hedge certain market risks (2) 294 867
Other servicing-related revenue 828
Total net servicing income 1,368 2,882
Total CRES mortgage banking income 1,866 4,585
Eliminations (3) (303) (711)
Total consolidated mortgage banking income $ 1,563 $ 3,874
(1) Represents the net change in fair value of the MSR asset due to the recognition of modeled
cash flows.
(2) Includes gains (losses) on sales of MSRs.
(3) Includes the effect of transfers of mortgage loans from CRES to the ALM portfolio included in
All Other and intercompany allocations of servicing costs.
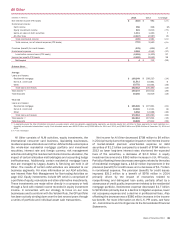
Core production revenue decreased $1.4 billion to $1.2 billion
in 2014 due to lower first mortgage origination volumes as
described below, and to a lesser extent, industry-wide margin
compression. The representations and warranties provision
decreased $157 million to $683 million and was primarily related
to non-government-sponsored enterprises exposures, partially
offset by lower exposure to mortgage insurance companies as a
result of settlements in 2014.
Net servicing income decreased $1.5 billion to $1.4 billion
driven by lower servicing fees due to a smaller servicing portfolio
and less favorable MSR net-of-hedge performance, partially offset
by lower amortization of expected cash flows. The decline in the
size of our servicing portfolio was driven by strategic sales of MSRs
during 2014 and 2013 as well as loan prepayment activity, which
exceeded new originations primarily due to our exit from non-retail
channels.