Bank of America 2014 Annual Report Download - page 69
Download and view the complete annual report
Please find page 69 of the 2014 Bank of America annual report below. You can navigate through the pages in the report by either clicking on the pages listed below, or by using the keyword search tool below to find specific information within the annual report.-
 1
1 -
2
-
3
-
4
-
5
-
6
-
7
-
8
-
9
-
10
-
11
-
12
-
13
-
14
-
15
-
16
-
17
-
18
-
19
-
20
-
21
-
22
-
23
-
24
-
25
-
26
-
27
-
28
-
29
-
30
-
31
-
32
-
33
-
34
-
35
-
36
-
37
-
38
-
39
-
40
-
41
-
42
-
43
-
44
-
45
-
46
-
47
-
48
-
49
-
50
-
51
-
52
-
53
-
54
-
55
-
56
-
57
-
58
-
 59
59 -
 60
60 -
 61
61 -
 62
62 -
 63
63 -
 64
64 -
 65
65 -
 66
66 -
 67
67 -
 68
68 -
 69
69 -
 70
70 -
 71
71 -
 72
72 -
 73
73 -
 74
74 -
 75
75 -
 76
76 -
 77
77 -
 78
78 -
 79
79 -
80
-
81
-
82
-
83
-
84
-
85
-
86
-
87
-
88
-
89
-
90
-
91
-
92
-
93
-
94
-
95
-
96
-
97
-
98
-
99
-
100
-
101
-
102
-
103
-
104
-
105
-
106
-
107
-
108
-
109
-
110
-
111
-
112
-
113
-
114
-
115
-
116
-
117
-
118
-
119
-
120
-
121
-
122
-
123
-
124
-
125
-
126
-
127
-
128
-
129
-
130
-
131
-
132
-
133
-
134
-
135
-
136
-
137
-
138
-
139
-
140
-
141
-
142
-
143
-
144
-
145
-
146
-
147
-
148
-
149
-
150
-
151
-
152
-
153
-
154
-
155
-
156
-
157
-
158
-
159
-
160
-
161
-
162
-
163
-
164
-
165
-
166
-
167
-
168
-
169
-
170
-
171
-
172
-
173
-
174
-
175
-
176
-
177
-
178
-
179
-
180
-
181
-
182
-
183
-
184
-
185
-
186
-
187
-
188
-
189
-
190
-
191
-
192
-
193
-
194
-
195
-
196
-
197
-
198
-
199
-
200
-
201
-
202
-
203
-
204
-
205
-
206
-
207
-
208
-
209
-
210
-
211
-
212
-
213
-
214
-
215
-
216
-
217
-
218
-
219
-
220
-
221
-
222
-
223
-
224
-
225
-
226
-
227
-
228
-
229
-
230
-
231
-
232
-
233
-
234
-
235
-
236
-
237
-
238
-
239
-
240
-
241
-
242
-
243
-
244
-
245
-
246
-
247
-
248
-
249
-
250
-
251
-
252
-
253
-
254
-
255
-
256
-
257
-
258
-
259
-
260
-
261
-
262
-
263
-
264
-
265
-
266
-
267
-
268
-
269
-
270
-
271
-
272
 |
 |
Bank of America 2014 67
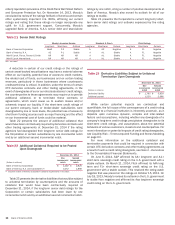
Credit Risk Management
Credit quality improved during 2014 due in part to improving
economic conditions. In addition, our proactive credit risk
management activities positively impacted the credit portfolio as
charge-offs and delinquencies continued to improve. For additional
information, see Executive Summary – 2014 Economic and
Business Environment on page 20.
Credit risk is the risk of loss arising from the inability or failure
of a borrower or counterparty to meet its obligations. Credit risk
can also arise from operational failures that result in an erroneous
advance, commitment or investment of funds. We define the credit
exposure to a borrower or counterparty as the loss potential arising
from all product classifications including loans and leases, deposit
overdrafts, derivatives, assets held-for-sale and unfunded lending
commitments which include loan commitments, letters of credit
and financial guarantees. Derivative positions are recorded at fair
value and assets held-for-sale are recorded at either fair value or
the lower of cost or fair value. Certain loans and unfunded
commitments are accounted for under the fair value option. Credit
risk for categories of assets carried at fair value is not accounted
for as part of the allowance for credit losses but as part of the fair
value adjustments recorded in earnings. For derivative positions,
our credit risk is measured as the net cost in the event the
counterparties with contracts in which we are in a gain position
fail to perform under the terms of those contracts. We use the
current fair value to represent credit exposure without giving
consideration to future mark-to-market changes. The credit risk
amounts take into consideration the effects of legally enforceable
master netting agreements and cash collateral. Our consumer and
commercial credit extension and review procedures encompass
funded and unfunded credit exposures. For more information on
derivatives and credit extension commitments, see Note 2 –
Derivatives and Note 12 – Commitments and Contingencies to the
Consolidated Financial Statements.
We manage credit risk based on the risk profile of the borrower
or counterparty, repayment sources, the nature of underlying
collateral, and other support given current events, conditions and
expectations. We classify our portfolios as either consumer or
commercial and monitor credit risk in each as discussed below.
We proactively refine our underwriting and credit management
practices as well as credit standards to meet the changing
economic environment. To actively mitigate losses and enhance
customer support in our consumer businesses, we have in place
collection programs and loan modification and customer
assistance infrastructures. We utilize a number of actions to
mitigate losses in the commercial businesses including increasing
the frequency and intensity of portfolio monitoring, hedging activity
and our practice of transferring management of deteriorating
commercial exposures to independent special asset officers as
credits enter criticized categories.
We have non-U.S. exposure largely in Europe and Asia Pacific.
For more information on our exposures and related risks in non-
U.S. countries, see Non-U.S. Portfolio on page 90 and Item 1A.
Risk Factors of our 2014 Annual Report on Form 10-K.
For more information on our credit risk management activities,
see Consumer Portfolio Credit Risk Management on page 67,
Commercial Portfolio Credit Risk Management on page 81, Non-
U.S. Portfolio on page 90, Provision for Credit Losses on page 92
and Allowance for Credit Losses on page 92, Note 1 – Summary
of Significant Accounting Principles, Note 4 – Outstanding Loans
and Leases and Note 5 – Allowance for Credit Losses to the
Consolidated Financial Statements.
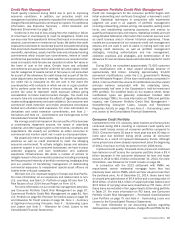
Consumer Portfolio Credit Risk Management
Credit risk management for the consumer portfolio begins with
initial underwriting and continues throughout a borrower’s credit
cycle. Statistical techniques in conjunction with experiential
judgment are used in all aspects of portfolio management
including underwriting, product pricing, risk appetite, setting credit
limits, and establishing operating processes and metrics to
quantify and balance risks and returns. Statistical models are built
using detailed behavioral information from external sources such
as credit bureaus and/or internal historical experience. These
models are a component of our consumer credit risk management
process and are used in part to assist in making both new and
ongoing credit decisions, as well as portfolio management
strategies, including authorizations and line management,
collection practices and strategies, and determination of the
allowance for loan and lease losses and allocated capital for credit
risk.
During 2014, we completed approximately 71,600 customer
loan modifications with a total unpaid principal balance of
approximately $13 billion, including approximately 33,400
permanent modifications, under the U.S. government’s Making
Home Affordable Program. Of the loan modifications completed in
2014, in terms of both the volume of modifications and the unpaid
principal balance associated with the underlying loans,
approximately half were in the Corporation’s held-for-investment
(HFI) portfolio. For modified loans on our balance sheet, these
modification types are generally considered troubled debt
restructurings (TDRs). For more information on TDRs and portfolio
impacts, see Consumer Portfolio Credit Risk Management –
Nonperforming Consumer Loans, Leases and Foreclosed
Properties Activity on page 79 and Note 4 – Outstanding Loans
and Leases to the Consolidated Financial Statements.
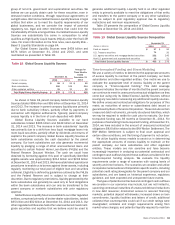
Consumer Credit Portfolio
Improvement in the U.S. economy, labor markets and home prices
continued during 2014 resulting in improved credit quality and
lower credit losses across all consumer portfolios compared to
2013. Consumer loans 30 days or more past due and 90 days or
more past due declined during 2014 across all consumer
portfolios as a result of improved delinquency trends. Although
home prices have shown steady improvement since the beginning
of 2012, they have not fully recovered to their 2006 levels.
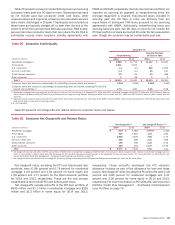
Improved credit quality, increased home prices and continued
loan balance run-off across the consumer portfolio drove a $3.4
billion decrease in the consumer allowance for loan and lease
losses in 2014 to $10.0 billion at December 31, 2014. For more
information, see Allowance for Credit Losses on page 92.
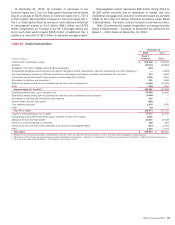
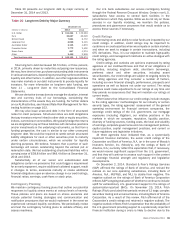
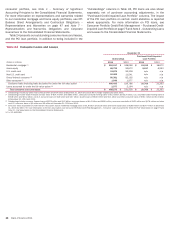
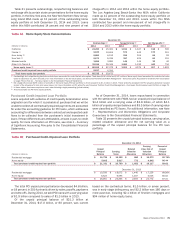
In connection with the 2013 settlement with FNMA, we
repurchased certain residential mortgage loans that had
previously been sold to FNMA, which we have valued at less than
the purchase price. As of December 31, 2014, these loans had
an unpaid principal balance of $4.4 billion and a carrying value of
$3.8 billion, of which $4.1 billion of unpaid principal balance and
$3.5 billion of carrying value were classified as PCI loans. All of
these loans are included in the Legacy Assets & Servicing portfolio
in Table 27. For more information on PCI loans, see Consumer
Portfolio Credit Risk Management – Purchased Credit-impaired
Loan Portfolio on page 75 and Note 4 – Outstanding Loans and
Leases to the Consolidated Financial Statements.
For more information on our accounting policies regarding
delinquencies, nonperforming status, charge-offs and TDRs for the