Bank of America 2014 Annual Report Download - page 85
Download and view the complete annual report
Please find page 85 of the 2014 Bank of America annual report below. You can navigate through the pages in the report by either clicking on the pages listed below, or by using the keyword search tool below to find specific information within the annual report.-
 1
1 -
2
-
3
-
4
-
5
-
6
-
7
-
8
-
9
-
10
-
11
-
12
-
13
-
14
-
15
-
16
-
17
-
18
-
19
-
20
-
21
-
22
-
23
-
24
-
25
-
26
-
27
-
28
-
29
-
30
-
31
-
32
-
33
-
34
-
35
-
36
-
37
-
38
-
39
-
40
-
41
-
42
-
43
-
44
-
45
-
46
-
47
-
48
-
49
-
50
-
51
-
52
-
53
-
54
-
55
-
56
-
57
-
58
-
59
-
60
-
61
-
62
-
63
-
64
-
65
-
66
-
67
-
68
-
69
-
70
-
71
-
72
-
73
-
74
-
 75
75 -
 76
76 -
 77
77 -
 78
78 -
 79
79 -
 80
80 -
 81
81 -
 82
82 -
 83
83 -
 84
84 -
 85
85 -
 86
86 -
 87
87 -
 88
88 -
 89
89 -
 90
90 -
 91
91 -
 92
92 -
 93
93 -
 94
94 -
 95
95 -
96
-
97
-
98
-
99
-
100
-
101
-
102
-
103
-
104
-
105
-
106
-
107
-
108
-
109
-
110
-
111
-
112
-
113
-
114
-
115
-
116
-
117
-
118
-
119
-
120
-
121
-
122
-
123
-
124
-
125
-
126
-
127
-
128
-
129
-
130
-
131
-
132
-
133
-
134
-
135
-
136
-
137
-
138
-
139
-
140
-
141
-
142
-
143
-
144
-
145
-
146
-
147
-
148
-
149
-
150
-
151
-
152
-
153
-
154
-
155
-
156
-
157
-
158
-
159
-
160
-
161
-
162
-
163
-
164
-
165
-
166
-
167
-
168
-
169
-
170
-
171
-
172
-
173
-
174
-
175
-
176
-
177
-
178
-
179
-
180
-
181
-
182
-
183
-
184
-
185
-
186
-
187
-
188
-
189
-
190
-
191
-
192
-
193
-
194
-
195
-
196
-
197
-
198
-
199
-
200
-
201
-
202
-
203
-
204
-
205
-
206
-
207
-
208
-
209
-
210
-
211
-
212
-
213
-
214
-
215
-
216
-
217
-
218
-
219
-
220
-
221
-
222
-
223
-
224
-
225
-
226
-
227
-
228
-
229
-
230
-
231
-
232
-
233
-
234
-
235
-
236
-
237
-
238
-
239
-
240
-
241
-
242
-
243
-
244
-
245
-
246
-
247
-
248
-
249
-
250
-
251
-
252
-
253
-
254
-
255
-
256
-
257
-
258
-
259
-
260
-
261
-
262
-
263
-
264
-
265
-
266
-
267
-
268
-
269
-
270
-
271
-
272
 |
 |

Bank of America 2014 83
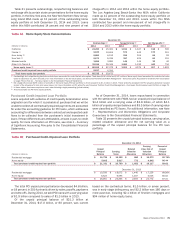
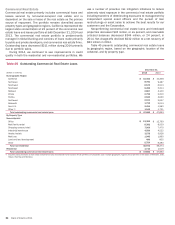
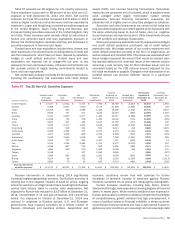
Table 43 presents commercial credit exposure by type for
utilized, unfunded and total binding committed credit exposure.
Commercial utilized credit exposure includes SBLCs and financial
guarantees, bankers’ acceptances and commercial letters of
credit for which we are legally bound to advance funds under
prescribed conditions, during a specified time period. Although
funds have not yet been advanced, these exposure types are
considered utilized for credit risk management purposes.
Total commercial utilized credit exposure decreased $852
million in 2014 primarily driven by loans and leases, SBLCs and
financial guarantees, debt securities and other investments,
partially offset by an increase in derivative assets. The utilization
rate for loans and leases, SBLCs and financial guarantees,
commercial letters of credit and bankers acceptances, in the
aggregate, was 57 percent and 58 percent at December 31, 2014
and 2013.
Table 43 Commercial Credit Exposure by Type
December 31
Commercial
Utilized (1)
Commercial
Unfunded (2, 3)
Total Commercial
Committed
(Dollars in millions) 2014 2013 2014 2013 2014 2013
Loans and leases $ 392,821 $396,283 $ 317,258 $307,478 $ 710,079 $ 703,761
Derivative assets (4) 52,682 47,495 ——52,682 47,495
Standby letters of credit and financial guarantees 33,550 35,893 745 1,334 34,295 37,227
Debt securities and other investments 17,301 18,505 5,315 6,903 22,616 25,408
Loans held-for-sale 7,036 6,604 2,315 101 9,351 6,705
Commercial letters of credit 2,037 2,054 126 515 2,163 2,569
Bankers’ acceptances 255 246 ——255 246
Foreclosed properties and other 960 414 ——960 414
Total $ 506,642 $507,494 $ 325,759 $316,331 $ 832,401 $ 823,825
(1) Total commercial utilized exposure includes loans of $6.6 billion and $7.9 billion and issued letters of credit accounted for under the fair value option with a notional amount of $535 million and
$503 million at December 31, 2014 and 2013.
(2) Total commercial unfunded exposure includes loan commitments accounted for under the fair value option with a notional amount of $9.4 billion and $12.5 billion at December 31, 2014 and 2013.
(3) Excludes unused business card lines which are not legally binding.
(4) Derivative assets are carried at fair value, reflect the effects of legally enforceable master netting agreements and have been reduced by cash collateral of $47.3 billion at both December 31, 2014
and 2013. Not reflected in utilized and committed exposure is additional derivative collateral held of $24.0 billion and $17.1 billion which consists primarily of other marketable securities.
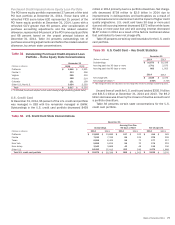
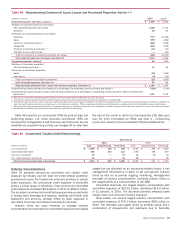
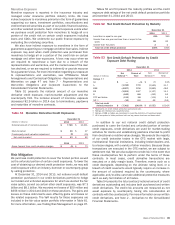
Table 44 presents commercial utilized reservable criticized
exposure by loan type. Criticized exposure corresponds to the
Special Mention, Substandard and Doubtful asset categories as
defined by regulatory authorities. Total commercial utilized
reservable criticized exposure decreased $1.3 billion, or 10
percent, in 2014 throughout most of the commercial portfolio
driven largely by paydowns, upgrades and charge-offs outpacing
downgrades. Approximately 87 percent and 84 percent of
commercial utilized reservable criticized exposure was secured at
December 31, 2014 and 2013.
Table 44 Commercial Utilized Reservable Criticized Exposure
December 31
2014 2013
(Dollars in millions) Amount (1) Percent (2) Amount (1) Percent (2)
U.S. commercial $ 7,597 3.07%$ 8,362 3.45%
Commercial real estate 1,108 2.24 1,452 2.92
Commercial lease financing 1,034 4.16 988 3.92
Non-U.S. commercial 887 1.03 1,424 1.49
10,626 2.60 12,226 2.96
U.S. small business commercial 944 7.10 635 4.77
Total commercial utilized reservable criticized exposure $ 11,570 2.74 $ 12,861 3.02
(1) Total commercial utilized reservable criticized exposure includes loans and leases of $10.2 billion and $11.5 billion and commercial letters of credit of $1.3 billion and $1.4 billion at December 31,
2014 and 2013.
(2) Percentages are calculated as commercial utilized reservable criticized exposure divided by total commercial utilized reservable exposure for each exposure category.
U.S. Commercial
At December 31, 2014, 63 percent of the U.S. commercial loan
portfolio, excluding small business, was managed in Global
Banking, 16 percent in Global Markets, 10 percent in GWIM
(generally business-purpose loans for high net worth clients) and
the remainder primarily in CBB. U.S. commercial loans, excluding
loans accounted for under the fair value option, increased $7.7
billion, or four percent, during 2014 with growth primarily from
middle-market and corporate clients. Nonperforming loans and
leases decreased $118 million, or 14 percent, in 2014. Net
charge-offs decreased $40 million to $88 million during 2014.