Bank of America 2014 Annual Report Download - page 142
Download and view the complete annual report
Please find page 142 of the 2014 Bank of America annual report below. You can navigate through the pages in the report by either clicking on the pages listed below, or by using the keyword search tool below to find specific information within the annual report.-
 1
1 -
2
-
3
-
4
-
5
-
6
-
7
-
8
-
9
-
10
-
11
-
12
-
13
-
14
-
15
-
16
-
17
-
18
-
19
-
20
-
21
-
22
-
23
-
24
-
25
-
26
-
27
-
28
-
29
-
30
-
31
-
32
-
33
-
34
-
35
-
36
-
37
-
38
-
39
-
40
-
41
-
42
-
43
-
44
-
45
-
46
-
47
-
48
-
49
-
50
-
51
-
52
-
53
-
54
-
55
-
56
-
57
-
58
-
59
-
60
-
61
-
62
-
63
-
64
-
65
-
66
-
67
-
68
-
69
-
70
-
71
-
72
-
73
-
74
-
75
-
76
-
77
-
78
-
79
-
80
-
81
-
82
-
83
-
84
-
85
-
86
-
87
-
88
-
89
-
90
-
91
-
92
-
93
-
94
-
95
-
96
-
97
-
98
-
99
-
100
-
101
-
102
-
103
-
104
-
105
-
106
-
107
-
108
-
109
-
110
-
111
-
112
-
113
-
114
-
115
-
116
-
117
-
118
-
119
-
120
-
121
-
122
-
123
-
124
-
125
-
126
-
127
-
128
-
129
-
130
-
131
-
 132
132 -
 133
133 -
 134
134 -
 135
135 -
 136
136 -
 137
137 -
 138
138 -
 139
139 -
 140
140 -
 141
141 -
 142
142 -
 143
143 -
 144
144 -
 145
145 -
 146
146 -
 147
147 -
 148
148 -
 149
149 -
 150
150 -
 151
151 -
 152
152 -
153
-
154
-
155
-
156
-
157
-
158
-
159
-
160
-
161
-
162
-
163
-
164
-
165
-
166
-
167
-
168
-
169
-
170
-
171
-
172
-
173
-
174
-
175
-
176
-
177
-
178
-
179
-
180
-
181
-
182
-
183
-
184
-
185
-
186
-
187
-
188
-
189
-
190
-
191
-
192
-
193
-
194
-
195
-
196
-
197
-
198
-
199
-
200
-
201
-
202
-
203
-
204
-
205
-
206
-
207
-
208
-
209
-
210
-
211
-
212
-
213
-
214
-
215
-
216
-
217
-
218
-
219
-
220
-
221
-
222
-
223
-
224
-
225
-
226
-
227
-
228
-
229
-
230
-
231
-
232
-
233
-
234
-
235
-
236
-
237
-
238
-
239
-
240
-
241
-
242
-
243
-
244
-
245
-
246
-
247
-
248
-
249
-
250
-
251
-
252
-
253
-
254
-
255
-
256
-
257
-
258
-
259
-
260
-
261
-
262
-
263
-
264
-
265
-
266
-
267
-
268
-
269
-
270
-
271
-
272
 |
 |

140 Bank of America 2014
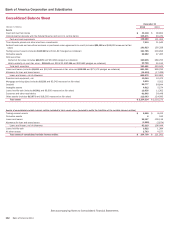
Bank of America Corporation and Subsidiaries
Consolidated Statement of Income
(Dollars in millions, except per share information) 2014 2013 2012
Interest income
Loans and leases $ 34,307 $ 36,470 $ 38,880
Debt securities 8,021 9,749 8,908
Federal funds sold and securities borrowed or purchased under agreements to resell 1,039 1,229 1,502
Trading account assets 4,561 4,706 5,094
Other interest income 2,958 2,866 3,016
Total interest income 50,886 55,020 57,400
Interest expense
Deposits 1,080 1,396 1,990
Short-term borrowings 2,578 2,923 3,572
Trading account liabilities 1,576 1,638 1,763
Long-term debt 5,700 6,798 9,419
Total interest expense 10,934 12,755 16,744
Net interest income 39,952 42,265 40,656
Noninterest income
Card income 5,944 5,826 6,121
Service charges 7,443 7,390 7,600
Investment and brokerage services 13,284 12,282 11,393
Investment banking income 6,065 6,126 5,299
Equity investment income 1,130 2,901 2,070
Trading account profits 6,309 7,056 5,870
Mortgage banking income 1,563 3,874 4,750
Gains on sales of debt securities 1,354 1,271 1,662
Other income (loss) 1,203 (49) (2,087)
Total noninterest income 44,295 46,677 42,678
Total revenue, net of interest expense 84,247 88,942 83,334
Provision for credit losses 2,275 3,556 8,169
Noninterest expense
Personnel 33,787 34,719 35,648
Occupancy 4,260 4,475 4,570
Equipment 2,125 2,146 2,269
Marketing 1,829 1,834 1,873
Professional fees 2,472 2,884 3,574
Amortization of intangibles 936 1,086 1,264
Data processing 3,144 3,170 2,961
Telecommunications 1,259 1,593 1,660
Other general operating 25,305 17,307 18,274
Total noninterest expense 75,117 69,214 72,093
Income before income taxes 6,855 16,172 3,072
Income tax expense (benefit) 2,022 4,741 (1,116)
Net income $ 4,833 $ 11,431 $ 4,188
Preferred stock dividends 1,044 1,349 1,428
Net income applicable to common shareholders $ 3,789 $ 10,082 $ 2,760
Per common share information
Earnings $0.36 $ 0.94 $ 0.26
Diluted earnings 0.36 0.90 0.25
Dividends paid 0.12 0.04 0.04
Average common shares issued and outstanding (in thousands) 10,527,818 10,731,165 10,746,028
Average diluted common shares issued and outstanding (in thousands) 10,584,535 11,491,418 10,840,854
See accompanying Notes to Consolidated Financial Statements.