Bank of America 2014 Annual Report Download - page 168
Download and view the complete annual report
Please find page 168 of the 2014 Bank of America annual report below. You can navigate through the pages in the report by either clicking on the pages listed below, or by using the keyword search tool below to find specific information within the annual report.-
 1
1 -
2
-
3
-
4
-
5
-
6
-
7
-
8
-
9
-
10
-
11
-
12
-
13
-
14
-
15
-
16
-
17
-
18
-
19
-
20
-
21
-
22
-
23
-
24
-
25
-
26
-
27
-
28
-
29
-
30
-
31
-
32
-
33
-
34
-
35
-
36
-
37
-
38
-
39
-
40
-
41
-
42
-
43
-
44
-
45
-
46
-
47
-
48
-
49
-
50
-
51
-
52
-
53
-
54
-
55
-
56
-
57
-
58
-
59
-
60
-
61
-
62
-
63
-
64
-
65
-
66
-
67
-
68
-
69
-
70
-
71
-
72
-
73
-
74
-
75
-
76
-
77
-
78
-
79
-
80
-
81
-
82
-
83
-
84
-
85
-
86
-
87
-
88
-
89
-
90
-
91
-
92
-
93
-
94
-
95
-
96
-
97
-
98
-
99
-
100
-
101
-
102
-
103
-
104
-
105
-
106
-
107
-
108
-
109
-
110
-
111
-
112
-
113
-
114
-
115
-
116
-
117
-
118
-
119
-
120
-
121
-
122
-
123
-
124
-
125
-
126
-
127
-
128
-
129
-
130
-
131
-
132
-
133
-
134
-
135
-
136
-
137
-
138
-
139
-
140
-
141
-
142
-
143
-
144
-
145
-
146
-
147
-
148
-
149
-
150
-
151
-
152
-
153
-
154
-
155
-
156
-
157
-
 158
158 -
 159
159 -
 160
160 -
 161
161 -
 162
162 -
 163
163 -
 164
164 -
 165
165 -
 166
166 -
 167
167 -
 168
168 -
 169
169 -
 170
170 -
 171
171 -
 172
172 -
 173
173 -
 174
174 -
 175
175 -
 176
176 -
 177
177 -
 178
178 -
179
-
180
-
181
-
182
-
183
-
184
-
185
-
186
-
187
-
188
-
189
-
190
-
191
-
192
-
193
-
194
-
195
-
196
-
197
-
198
-
199
-
200
-
201
-
202
-
203
-
204
-
205
-
206
-
207
-
208
-
209
-
210
-
211
-
212
-
213
-
214
-
215
-
216
-
217
-
218
-
219
-
220
-
221
-
222
-
223
-
224
-
225
-
226
-
227
-
228
-
229
-
230
-
231
-
232
-
233
-
234
-
235
-
236
-
237
-
238
-
239
-
240
-
241
-
242
-
243
-
244
-
245
-
246
-
247
-
248
-
249
-
250
-
251
-
252
-
253
-
254
-
255
-
256
-
257
-
258
-
259
-
260
-
261
-
262
-
263
-
264
-
265
-
266
-
267
-
268
-
269
-
270
-
271
-
272
 |
 |

166 Bank of America 2014
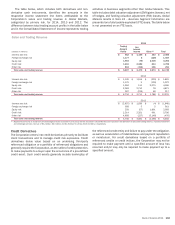
Valuation Adjustments on Derivatives
The Corporation records credit risk valuation adjustments on
derivatives in order to properly reflect the credit quality of the
counterparties and its own credit quality. The Corporation
calculates valuation adjustments on derivatives based on a
modeled expected exposure that incorporates current market risk
factors. The exposure also takes into consideration credit
mitigants such as enforceable master netting agreements and
collateral. CDS spread data is used to estimate the default
probabilities and severities that are applied to the exposures.
Where no observable credit default data is available for
counterparties, the Corporation uses proxies and other market
data to estimate default probabilities and severity.
Valuation adjustments on derivatives are affected by changes
in market spreads, non-credit-related market factors such as
interest rate and currency changes that affect the expected
exposure, and other factors like changes in collateral
arrangements and partial payments. Credit spreads and non-credit
factors can move independently. For example, for an interest rate
swap, changes in interest rates may increase the expected
exposure, which would increase the counterparty credit valuation
adjustment (CVA). Independently, counterparty credit spreads may
tighten, which would result in an offsetting decrease to CVA.
The Corporation enters into risk management activities to
offset market driven exposures. The Corporation often hedges the
counterparty spread risk in CVA with CDS. The Corporation hedges
other market risks in both CVA and DVA primarily with currency and
interest rate swaps. Since the components of the valuation
adjustments on derivatives move independently and the
Corporation may not hedge all of the market-driven exposures, the
effect of a hedge may increase the gains or losses relating to
valuation adjustments on derivatives or may result in a gross gain
from valuation adjustments on derivatives becoming a negative
adjustment (or the reverse).
In 2014, the Corporation adopted FVA into valuation estimates
primarily to include funding costs on uncollateralized derivatives
and derivatives where the Corporation is not permitted to use the
collateral it receives. The change in estimate resulted in a net
pretax FVA charge of $497 million including a charge of $632
million related to funding costs associated with derivative asset
exposures, partially offset by a funding benefit of $135 million
related to derivative liability exposures. The net FVA charge was
recorded as a reduction to sales and trading revenue in Global
Markets. The Corporation calculated this valuation adjustment
based on modeled expected exposure profiles discounted for the
funding risk premium inherent in these derivatives. FVA related to
derivative assets and liabilities is the effect of funding costs on
the fair value of these derivatives.
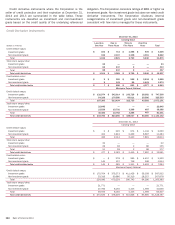
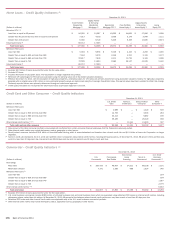
The table below presents CVA, DVA and FVA gains (losses) on
derivatives, which are recorded in trading account profits, on a
gross and net of hedge basis for 2014, 2013 and 2012. CVA gains
reduce the cumulative CVA thereby increasing the derivative assets
balance. DVA gains increase the cumulative DVA thereby
decreasing the derivative liabilities balance. CVA and DVA losses
have the opposite impact. FVA gains related to derivative assets
reduce the cumulative FVA thereby increasing the derivative assets
balance. FVA gains related to derivative liabilities increase the
cumulative FVA thereby decreasing the derivative liabilities
balance.
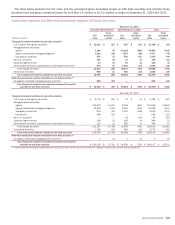
Valuation Adjustments on Derivatives
Gains (Losses)
2014 2013 2012
(Dollars in millions) Gross Net Gross Net Gross Net
Derivative assets (CVA) (1) $(22)$
191 $ 738 $ (96) $ 1,022 $ 291
Derivative assets (FVA) (2) (632) (632) n/a n/a n/a n/a
Derivative liabilities (DVA) (3) (28) (150) (39) (75) (2,212) (2,477)
Derivative liabilities (FVA) (2) 135 135 n/a n/a n/a n/a
(1) At December 31, 2014, 2013 and 2012, the cumulative CVA reduced the derivative assets balance by $1.6 billion, $1.6 billion and $2.4 billion, respectively.
(2) FVA was adopted in 2014 and the cumulative FVA reduced the net derivatives balance by $497 million.
(3) At December 31, 2014, 2013 and 2012, the cumulative DVA reduced the derivative liabilities balance by $0.8 billion, $0.8 billion and $0.8 billion, respectively.
n/a = not applicable