Bank of America 2014 Annual Report Download - page 18
Download and view the complete annual report
Please find page 18 of the 2014 Bank of America annual report below. You can navigate through the pages in the report by either clicking on the pages listed below, or by using the keyword search tool below to find specific information within the annual report.-
 1
1 -
2
-
3
-
4
-
5
-
6
-
7
-
 8
8 -
 9
9 -
 10
10 -
 11
11 -
 12
12 -
 13
13 -
 14
14 -
 15
15 -
 16
16 -
 17
17 -
 18
18 -
 19
19 -
 20
20 -
 21
21 -
 22
22 -
 23
23 -
 24
24 -
 25
25 -
 26
26 -
 27
27 -
 28
28 -
29
-
30
-
31
-
32
-
33
-
34
-
35
-
36
-
37
-
38
-
39
-
40
-
41
-
42
-
43
-
44
-
45
-
46
-
47
-
48
-
49
-
50
-
51
-
52
-
53
-
54
-
55
-
56
-
57
-
58
-
59
-
60
-
61
-
62
-
63
-
64
-
65
-
66
-
67
-
68
-
69
-
70
-
71
-
72
-
73
-
74
-
75
-
76
-
77
-
78
-
79
-
80
-
81
-
82
-
83
-
84
-
85
-
86
-
87
-
88
-
89
-
90
-
91
-
92
-
93
-
94
-
95
-
96
-
97
-
98
-
99
-
100
-
101
-
102
-
103
-
104
-
105
-
106
-
107
-
108
-
109
-
110
-
111
-
112
-
113
-
114
-
115
-
116
-
117
-
118
-
119
-
120
-
121
-
122
-
123
-
124
-
125
-
126
-
127
-
128
-
129
-
130
-
131
-
132
-
133
-
134
-
135
-
136
-
137
-
138
-
139
-
140
-
141
-
142
-
143
-
144
-
145
-
146
-
147
-
148
-
149
-
150
-
151
-
152
-
153
-
154
-
155
-
156
-
157
-
158
-
159
-
160
-
161
-
162
-
163
-
164
-
165
-
166
-
167
-
168
-
169
-
170
-
171
-
172
-
173
-
174
-
175
-
176
-
177
-
178
-
179
-
180
-
181
-
182
-
183
-
184
-
185
-
186
-
187
-
188
-
189
-
190
-
191
-
192
-
193
-
194
-
195
-
196
-
197
-
198
-
199
-
200
-
201
-
202
-
203
-
204
-
205
-
206
-
207
-
208
-
209
-
210
-
211
-
212
-
213
-
214
-
215
-
216
-
217
-
218
-
219
-
220
-
221
-
222
-
223
-
224
-
225
-
226
-
227
-
228
-
229
-
230
-
231
-
232
-
233
-
234
-
235
-
236
-
237
-
238
-
239
-
240
-
241
-
242
-
243
-
244
-
245
-
246
-
247
-
248
-
249
-
250
-
251
-
252
-
253
-
254
-
255
-
256
-
257
-
258
-
259
-
260
-
261
-
262
-
263
-
264
-
265
-
266
-
267
-
268
-
269
-
270
-
271
-
272
 |
 |

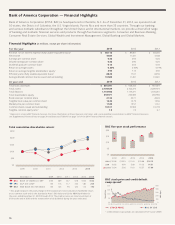
December 31 2009 2010 2011 2012 2013 2014
BAC BANK OF AMERICA CORP $100 $89 $37 $78 $105 $122
SPX S&P 500 COMP 100 115 117 136 180 205
BKX KBW BANK SECTOR INDEX 100 123 95 126 173 190
2 This graph compares the yearly change in the Corporation’s total cumulative shareholder return
on its common stock with (i) the Standard & Poor’s 500 Index and (ii) the KBW Bank Index for
the years ended December 31, 2009 through 2014. The graph assumes an initial investment of
$100 at the end of 2009 and the reinvestment of all dividends during the years indicated.
Total cumulative shareholder return2
$0
$50
$100
$150
$200
$250
201420132012201120102009
HIGH $19.48 $15.25 $11.61 $15.88 $18.13
LOW 10.95 4.99 5.80 11.03 14.51
CLOSE 13.34 5.56 11.61 15.57 17.89
BAC five-year stock performance
$0
$5
$10
$15
$20
2014
2013201220112010
BAC stock price and credit default
swap spread3
12 /31/11
500
400
300
200
100
0
$20
$15
$10
$5
$0
6/30/12 12/31/12 6/30/13 12/ 31/13 6/30/14 12/31/14
CDS (bps)
Stock Price
STOCK PRICE BAC 5Y CDS
3 Credit default swap spreads are calculated off of 5-year LIBOR.
Bank of America Corporation — Financial Highlights
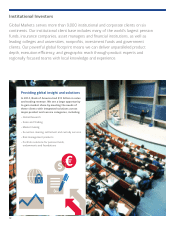
Bank of America Corporation (NYSE: BAC) is headquartered in Charlotte, N.C. As of December 31, 2014, we operated in all
50 states, the District of Columbia, the U.S. Virgin Islands, Puerto Rico and more than 35 countries. Through our banking
and various nonbank subsidiaries throughout the United States and in international markets, we provide a diversified range
of banking and nonbank financial services and products through five business segments: Consumer and Business Banking,
Consumer Real Estate Services, Global Wealth and Investment Management, Global Banking and Global Markets.
Financial Highlights (in millions, except per share information)
For the year 2014 2013 2012
Revenue, net of interest expense (fully taxable-equivalent basis)1 $ 85,116 $ 89,801 $ 84,235
Net income 4,833 11,431 4,188
Earnings per common share 0.36 0.94 0.26
Diluted earnings per common share 0.36 0.90 0.25
Dividends paid per common share 0.12 0.04 0.04
Return on average assets 0.23% 0.53% 0.19%
Return on average tangible shareholders’ equity12.92 7.13 2.60
Efficiency ratio (fully taxable-equivalent basis)188.25 77.07 85.59
Average diluted common shares issued and outstanding 10,585 11,491 10,841
At year end 2014 2013 2012
Total loans and leases $ 881,391 $ 928,233 $ 907,819
Total assets 2,104,534 2,102,273 2,209,974
Total deposits 1,118,936 1,119,271 1,105,261
Total shareholders’ equity 243,471 232,685 236,956
Book value per common share 21.32 20.71 20.24
Tangible book value per common share114.43 13.79 13.36
Market price per common share 17.89 15.57 11.61
Common shares issued and outstanding 10,517 10,592 10,778
Tangible common equity ratio17.5 7.2 6.7
1 Represents a non-GAAP financial measure. For more information on these measures and ratios, and a corresponding reconciliation to GAAP financial measures,
see Supplemental Financial Data on page 29 and Statistical Table XV on page 131 of the 2014 Financial Review section.
16