Bank of America 2014 Annual Report Download - page 134
Download and view the complete annual report
Please find page 134 of the 2014 Bank of America annual report below. You can navigate through the pages in the report by either clicking on the pages listed below, or by using the keyword search tool below to find specific information within the annual report.-
 1
1 -
2
-
3
-
4
-
5
-
6
-
7
-
8
-
9
-
10
-
11
-
12
-
13
-
14
-
15
-
16
-
17
-
18
-
19
-
20
-
21
-
22
-
23
-
24
-
25
-
26
-
27
-
28
-
29
-
30
-
31
-
32
-
33
-
34
-
35
-
36
-
37
-
38
-
39
-
40
-
41
-
42
-
43
-
44
-
45
-
46
-
47
-
48
-
49
-
50
-
51
-
52
-
53
-
54
-
55
-
56
-
57
-
58
-
59
-
60
-
61
-
62
-
63
-
64
-
65
-
66
-
67
-
68
-
69
-
70
-
71
-
72
-
73
-
74
-
75
-
76
-
77
-
78
-
79
-
80
-
81
-
82
-
83
-
84
-
85
-
86
-
87
-
88
-
89
-
90
-
91
-
92
-
93
-
94
-
95
-
96
-
97
-
98
-
99
-
100
-
101
-
102
-
103
-
104
-
105
-
106
-
107
-
108
-
109
-
110
-
111
-
112
-
113
-
114
-
115
-
116
-
117
-
118
-
119
-
120
-
121
-
122
-
123
-
 124
124 -
 125
125 -
 126
126 -
 127
127 -
 128
128 -
 129
129 -
 130
130 -
 131
131 -
 132
132 -
 133
133 -
 134
134 -
 135
135 -
 136
136 -
 137
137 -
 138
138 -
 139
139 -
 140
140 -
 141
141 -
 142
142 -
 143
143 -
 144
144 -
145
-
146
-
147
-
148
-
149
-
150
-
151
-
152
-
153
-
154
-
155
-
156
-
157
-
158
-
159
-
160
-
161
-
162
-
163
-
164
-
165
-
166
-
167
-
168
-
169
-
170
-
171
-
172
-
173
-
174
-
175
-
176
-
177
-
178
-
179
-
180
-
181
-
182
-
183
-
184
-
185
-
186
-
187
-
188
-
189
-
190
-
191
-
192
-
193
-
194
-
195
-
196
-
197
-
198
-
199
-
200
-
201
-
202
-
203
-
204
-
205
-
206
-
207
-
208
-
209
-
210
-
211
-
212
-
213
-
214
-
215
-
216
-
217
-
218
-
219
-
220
-
221
-
222
-
223
-
224
-
225
-
226
-
227
-
228
-
229
-
230
-
231
-
232
-
233
-
234
-
235
-
236
-
237
-
238
-
239
-
240
-
241
-
242
-
243
-
244
-
245
-
246
-
247
-
248
-
249
-
250
-
251
-
252
-
253
-
254
-
255
-
256
-
257
-
258
-
259
-
260
-
261
-
262
-
263
-
264
-
265
-
266
-
267
-
268
-
269
-
270
-
271
-
272
 |
 |

132 Bank of America 2014
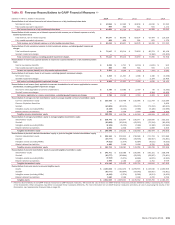
Table XVI Two-year Reconciliations to GAAP Financial Measures (1, 2)
(Dollars in millions) 2014 2013
Consumer & Business Banking
Reported net income $ 7,096 $ 6,647
Adjustment related to intangibles (3) 47
Adjusted net income $ 7,100 $ 6,654
Average allocated equity (4) $61,449 $ 62,037
Adjustment related to goodwill and a percentage of intangibles (31,949) (32,037)
Average allocated capital $ 29,500 $ 30,000
Deposits
Reported net income $ 2,847 $ 2,123
Adjustment related to intangibles (3) —1
Adjusted net income $ 2,847 $ 2,124
Average allocated equity (4) $36,484 $ 35,392
Adjustment related to goodwill and a percentage of intangibles (19,984) (19,992)
Average allocated capital $ 16,500 $ 15,400
Consumer Lending
Reported net income $ 4,249 $ 4,524
Adjustment related to intangibles (3) 47
Adjusted net income $ 4,253 $ 4,531
Average allocated equity (4) $24,965 $ 26,644
Adjustment related to goodwill and a percentage of intangibles (11,965) (12,044)
Average allocated capital $ 13,000 $ 14,600
Global Wealth & Investment Management
Reported net income $ 2,974 $ 2,977
Adjustment related to intangibles (3) 13 16
Adjusted net income $ 2,987 $ 2,993
Average allocated equity (4) $22,214 $ 20,292
Adjustment related to goodwill and a percentage of intangibles (10,214) (10,292)
Average allocated capital $ 12,000 $ 10,000
Global Banking
Reported net income $ 5,435 $ 4,973
Adjustment related to intangibles (3) 23
Adjusted net income $ 5,437 $ 4,976
Average allocated equity (4) $53,404 $ 45,412
Adjustment related to goodwill and a percentage of intangibles (22,404) (22,412)
Average allocated capital $ 31,000 $ 23,000
Global Markets
Reported net income $ 2,719 $ 1,153
Adjustment related to intangibles (3) 99
Adjusted net income $ 2,728 $ 1,162
Average allocated equity (4) $39,374 $ 35,370
Adjustment related to goodwill and a percentage of intangibles (5,374)(5,370)
Average allocated capital $ 34,000 $ 30,000
(1) Presents reconciliations of non-GAAP financial measures to GAAP financial measures. We believe the use of these non-GAAP financial measures provides additional clarity in assessing the results
of the Corporation and our segments. Other companies may define or calculate these measures differently. For more information on non-GAAP financial measures and ratios we use in assessing the
results of the Corporation, see Supplemental Financial Data on page 29.
(2) There are no adjustments to reported net income (loss) or average allocated equity for CRES.
(3) Represents cost of funds, earnings credits and certain expenses related to intangibles.
(4) Average allocated equity is comprised of average allocated capital plus capital for the portion of goodwill and intangibles specifically assigned to the business segment. For more information on
allocated capital, see Business Segment Operations on page 31 and Note 8 – Goodwill and Intangible Assets to the Consolidated Financial Statements.