Bank of America 2014 Annual Report Download - page 227
Download and view the complete annual report
Please find page 227 of the 2014 Bank of America annual report below. You can navigate through the pages in the report by either clicking on the pages listed below, or by using the keyword search tool below to find specific information within the annual report.-
 1
1 -
2
-
3
-
4
-
5
-
6
-
7
-
8
-
9
-
10
-
11
-
12
-
13
-
14
-
15
-
16
-
17
-
18
-
19
-
20
-
21
-
22
-
23
-
24
-
25
-
26
-
27
-
28
-
29
-
30
-
31
-
32
-
33
-
34
-
35
-
36
-
37
-
38
-
39
-
40
-
41
-
42
-
43
-
44
-
45
-
46
-
47
-
48
-
49
-
50
-
51
-
52
-
53
-
54
-
55
-
56
-
57
-
58
-
59
-
60
-
61
-
62
-
63
-
64
-
65
-
66
-
67
-
68
-
69
-
70
-
71
-
72
-
73
-
74
-
75
-
76
-
77
-
78
-
79
-
80
-
81
-
82
-
83
-
84
-
85
-
86
-
87
-
88
-
89
-
90
-
91
-
92
-
93
-
94
-
95
-
96
-
97
-
98
-
99
-
100
-
101
-
102
-
103
-
104
-
105
-
106
-
107
-
108
-
109
-
110
-
111
-
112
-
113
-
114
-
115
-
116
-
117
-
118
-
119
-
120
-
121
-
122
-
123
-
124
-
125
-
126
-
127
-
128
-
129
-
130
-
131
-
132
-
133
-
134
-
135
-
136
-
137
-
138
-
139
-
140
-
141
-
142
-
143
-
144
-
145
-
146
-
147
-
148
-
149
-
150
-
151
-
152
-
153
-
154
-
155
-
156
-
157
-
158
-
159
-
160
-
161
-
162
-
163
-
164
-
165
-
166
-
167
-
168
-
169
-
170
-
171
-
172
-
173
-
174
-
175
-
176
-
177
-
178
-
179
-
180
-
181
-
182
-
183
-
184
-
185
-
186
-
187
-
188
-
189
-
190
-
191
-
192
-
193
-
194
-
195
-
196
-
197
-
198
-
199
-
200
-
201
-
202
-
203
-
204
-
205
-
206
-
207
-
208
-
209
-
210
-
211
-
212
-
213
-
214
-
215
-
216
-
 217
217 -
 218
218 -
 219
219 -
 220
220 -
 221
221 -
 222
222 -
 223
223 -
 224
224 -
 225
225 -
 226
226 -
 227
227 -
 228
228 -
 229
229 -
 230
230 -
 231
231 -
 232
232 -
 233
233 -
 234
234 -
 235
235 -
 236
236 -
 237
237 -
238
-
239
-
240
-
241
-
242
-
243
-
244
-
245
-
246
-
247
-
248
-
249
-
250
-
251
-
252
-
253
-
254
-
255
-
256
-
257
-
258
-
259
-
260
-
261
-
262
-
263
-
264
-
265
-
266
-
267
-
268
-
269
-
270
-
271
-
272
 |
 |

Bank of America 2014 225
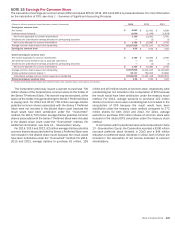
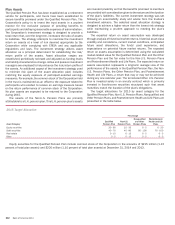
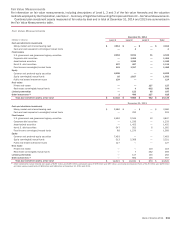
NOTE 15 Earnings Per Common Share
The calculation of earnings per common share (EPS) and diluted EPS for 2014, 2013 and 2012 is presented below. For more information
on the calculation of EPS, see Note 1 – Summary of Significant Accounting Principles.
(Dollars in millions, except per share information; shares in thousands) 2014 2013 2012
Earnings per common share
Net income $ 4,833 $ 11,431 $ 4,188
Preferred stock dividends (1,044)(1,349) (1,428)
Net income applicable to common shareholders 3,789 10,082 2,760
Dividends and undistributed earnings allocated to participating securities —(2)(2)
Net income allocated to common shareholders $ 3,789 $ 10,080 $ 2,758
Average common shares issued and outstanding 10,527,818 10,731,165 10,746,028
Earnings per common share $ 0.36 $ 0.94 $ 0.26
Diluted earnings per common share
Net income applicable to common shareholders $ 3,789 $ 10,082 $ 2,760
Add preferred stock dividends due to assumed conversions —300 —
Dividends and undistributed earnings allocated to participating securities —(2)(2)
Net income allocated to common shareholders $ 3,789 $ 10,380 $ 2,758
Average common shares issued and outstanding 10,527,818 10,731,165 10,746,028
Dilutive potential common shares (1) 56,717 760,253 94,826
Total diluted average common shares issued and outstanding 10,584,535 11,491,418 10,840,854
Diluted earnings per common share $ 0.36 $ 0.90 $ 0.25
(1) Includes incremental dilutive shares from restricted stock units, restricted stock, stock options and warrants.
The Corporation previously issued a warrant to purchase 700
million shares of the Corporation’s common stock to the holder of
the Series T Preferred Stock. The warrant may be exercised, at the
option of the holder, through tendering the Series T Preferred Stock
or paying cash. For 2014 and 2012, 700 million average dilutive
potential common shares associated with the Series T Preferred
Stock were not included in the diluted share count because the
result would have been antidilutive under the “if-converted”
method. For 2013, 700 million average dilutive potential common
shares associated with the Series T Preferred Stock were included
in the diluted share count under the “if-converted” method. For
additional information, see Note 13 – Shareholders’ Equity.
For 2014, 2013 and 2012, 62 million average dilutive potential
common shares associated with the Series L Preferred Stock were
not included in the diluted share count because the result would
have been antidilutive under the “if-converted” method. For 2014,
2013 and 2012, average options to purchase 91 million, 126
million and 163 million shares of common stock, respectively, were
outstanding but not included in the computation of EPS because
the result would have been antidilutive under the treasury stock
method. For 2014, average warrants to purchase 122 million
shares of common stock were outstanding but not included in the
computation of EPS because the result would have been
antidilutive under the treasury stock method compared to 272
million shares for both 2013 and 2012. For 2014, average
warrants to purchase 150 million shares of common stock were
included in the diluted EPS calculation under the treasury stock
method.
In connection with the preferred stock actions described in Note
13 – Shareholders’ Equity, the Corporation recorded a $100 million
non-cash preferred stock dividend in 2013 and a $44 million
reduction to preferred stock dividends in 2012, both of which are
included in the calculation of net income allocated to common
shareholders.