Bank of America 2014 Annual Report Download - page 70
Download and view the complete annual report
Please find page 70 of the 2014 Bank of America annual report below. You can navigate through the pages in the report by either clicking on the pages listed below, or by using the keyword search tool below to find specific information within the annual report.-
 1
1 -
2
-
3
-
4
-
5
-
6
-
7
-
8
-
9
-
10
-
11
-
12
-
13
-
14
-
15
-
16
-
17
-
18
-
19
-
20
-
21
-
22
-
23
-
24
-
25
-
26
-
27
-
28
-
29
-
30
-
31
-
32
-
33
-
34
-
35
-
36
-
37
-
38
-
39
-
40
-
41
-
42
-
43
-
44
-
45
-
46
-
47
-
48
-
49
-
50
-
51
-
52
-
53
-
54
-
55
-
56
-
57
-
58
-
59
-
 60
60 -
 61
61 -
 62
62 -
 63
63 -
 64
64 -
 65
65 -
 66
66 -
 67
67 -
 68
68 -
 69
69 -
 70
70 -
 71
71 -
 72
72 -
 73
73 -
 74
74 -
 75
75 -
 76
76 -
 77
77 -
 78
78 -
 79
79 -
 80
80 -
81
-
82
-
83
-
84
-
85
-
86
-
87
-
88
-
89
-
90
-
91
-
92
-
93
-
94
-
95
-
96
-
97
-
98
-
99
-
100
-
101
-
102
-
103
-
104
-
105
-
106
-
107
-
108
-
109
-
110
-
111
-
112
-
113
-
114
-
115
-
116
-
117
-
118
-
119
-
120
-
121
-
122
-
123
-
124
-
125
-
126
-
127
-
128
-
129
-
130
-
131
-
132
-
133
-
134
-
135
-
136
-
137
-
138
-
139
-
140
-
141
-
142
-
143
-
144
-
145
-
146
-
147
-
148
-
149
-
150
-
151
-
152
-
153
-
154
-
155
-
156
-
157
-
158
-
159
-
160
-
161
-
162
-
163
-
164
-
165
-
166
-
167
-
168
-
169
-
170
-
171
-
172
-
173
-
174
-
175
-
176
-
177
-
178
-
179
-
180
-
181
-
182
-
183
-
184
-
185
-
186
-
187
-
188
-
189
-
190
-
191
-
192
-
193
-
194
-
195
-
196
-
197
-
198
-
199
-
200
-
201
-
202
-
203
-
204
-
205
-
206
-
207
-
208
-
209
-
210
-
211
-
212
-
213
-
214
-
215
-
216
-
217
-
218
-
219
-
220
-
221
-
222
-
223
-
224
-
225
-
226
-
227
-
228
-
229
-
230
-
231
-
232
-
233
-
234
-
235
-
236
-
237
-
238
-
239
-
240
-
241
-
242
-
243
-
244
-
245
-
246
-
247
-
248
-
249
-
250
-
251
-
252
-
253
-
254
-
255
-
256
-
257
-
258
-
259
-
260
-
261
-
262
-
263
-
264
-
265
-
266
-
267
-
268
-
269
-
270
-
271
-
272
 |
 |

68 Bank of America 2014
consumer portfolio, see Note 1 – Summary of Significant
Accounting Principles to the Consolidated Financial Statements.
For more information on representations and warranties related
to our residential mortgage and home equity portfolios, see Off-
Balance Sheet Arrangements and Contractual Obligations –
Representations and Warranties on page 47 and Note 7 –
Representations and Warranties Obligations and Corporate
Guarantees to the Consolidated Financial Statements.
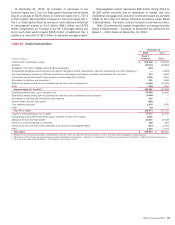
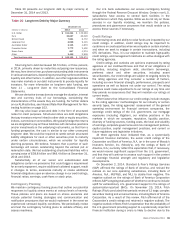
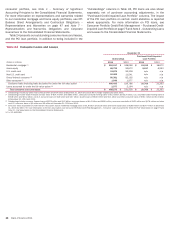
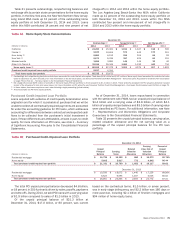
Table 24 presents our outstanding consumer loans and leases,
and the PCI loan portfolio. In addition to being included in the
“Outstandings” columns in Table 24, PCI loans are also shown
separately, net of purchase accounting adjustments, in the
“Purchased Credit-impaired Loan Portfolio” columns. The impact
of the PCI loan portfolio on certain credit statistics is reported
where appropriate. For more information on PCI loans, see
Consumer Portfolio Credit Risk Management – Purchased Credit-
impaired Loan Portfolio on page 75 and Note 4 – Outstanding Loans
and Leases to the Consolidated Financial Statements.
Table 24 Consumer Loans and Leases
December 31
Outstandings
Purchased Credit-impaired
Loan Portfolio
(Dollars in millions) 2014 2013 2014 2013
Residential mortgage (1) $ 216,197 $248,066 $15,152 $ 18,672
Home equity 85,725 93,672 5,617 6,593
U.S. credit card 91,879 92,338 n/a n/a
Non-U.S. credit card 10,465 11,541 n/a n/a
Direct/Indirect consumer (2) 80,381 82,192 n/a n/a
Other consumer (3) 1,846 1,977 n/a n/a
Consumer loans excluding loans accounted for under the fair value option 486,493 529,786 20,769 25,265
Loans accounted for under the fair value option (4) 2,077 2,164 n/a n/a
Total consumer loans and leases $ 488,570 $531,950 $20,769 $ 25,265
(1) Outstandings include pay option loans of $3.2 billion and $4.4 billion at December 31, 2014 and 2013. We no longer originate pay option loans.
(2) Outstandings include dealer financial services loans of $37.7 billion and $38.5 billion, unsecured consumer lending loans of $1.5 billion and $2.7 billion, U.S. securities-based lending loans of
$35.8 billion and $31.2 billion, non-U.S. consumer loans of $4.0 billion and $4.7 billion, student loans of $632 million and $4.1 billion and other consumer loans of $761 million and $1.0 billion
at December 31, 2014 and 2013.
(3) Outstandings include consumer finance loans of $676 million and $1.2 billion, consumer leases of $1.0 billion and $606 million, consumer overdrafts of $162 million and $176 million and other
non-U.S. consumer loans of $3 million and $5 million at December 31, 2014 and 2013.
(4) Consumer loans accounted for under the fair value option include residential mortgage loans of $1.9 billion and $2.0 billion and home equity loans of $196 million and $147 million at December
31, 2014 and 2013. For more information on the fair value option, see Consumer Portfolio Credit Risk Management – Consumer Loans Accounted for Under the Fair Value Option on page 79 and
Note 21 – Fair Value Option to the Consolidated Financial Statements.
n/a = not applicable