Bank of America 2014 Annual Report Download - page 36
Download and view the complete annual report
Please find page 36 of the 2014 Bank of America annual report below. You can navigate through the pages in the report by either clicking on the pages listed below, or by using the keyword search tool below to find specific information within the annual report.-
 1
1 -
2
-
3
-
4
-
5
-
6
-
7
-
8
-
9
-
10
-
11
-
12
-
13
-
14
-
15
-
16
-
17
-
18
-
19
-
20
-
21
-
22
-
23
-
24
-
25
-
 26
26 -
 27
27 -
 28
28 -
 29
29 -
 30
30 -
 31
31 -
 32
32 -
 33
33 -
 34
34 -
 35
35 -
 36
36 -
 37
37 -
 38
38 -
 39
39 -
 40
40 -
 41
41 -
 42
42 -
 43
43 -
 44
44 -
 45
45 -
 46
46 -
47
-
48
-
49
-
50
-
51
-
52
-
53
-
54
-
55
-
56
-
57
-
58
-
59
-
60
-
61
-
62
-
63
-
64
-
65
-
66
-
67
-
68
-
69
-
70
-
71
-
72
-
73
-
74
-
75
-
76
-
77
-
78
-
79
-
80
-
81
-
82
-
83
-
84
-
85
-
86
-
87
-
88
-
89
-
90
-
91
-
92
-
93
-
94
-
95
-
96
-
97
-
98
-
99
-
100
-
101
-
102
-
103
-
104
-
105
-
106
-
107
-
108
-
109
-
110
-
111
-
112
-
113
-
114
-
115
-
116
-
117
-
118
-
119
-
120
-
121
-
122
-
123
-
124
-
125
-
126
-
127
-
128
-
129
-
130
-
131
-
132
-
133
-
134
-
135
-
136
-
137
-
138
-
139
-
140
-
141
-
142
-
143
-
144
-
145
-
146
-
147
-
148
-
149
-
150
-
151
-
152
-
153
-
154
-
155
-
156
-
157
-
158
-
159
-
160
-
161
-
162
-
163
-
164
-
165
-
166
-
167
-
168
-
169
-
170
-
171
-
172
-
173
-
174
-
175
-
176
-
177
-
178
-
179
-
180
-
181
-
182
-
183
-
184
-
185
-
186
-
187
-
188
-
189
-
190
-
191
-
192
-
193
-
194
-
195
-
196
-
197
-
198
-
199
-
200
-
201
-
202
-
203
-
204
-
205
-
206
-
207
-
208
-
209
-
210
-
211
-
212
-
213
-
214
-
215
-
216
-
217
-
218
-
219
-
220
-
221
-
222
-
223
-
224
-
225
-
226
-
227
-
228
-
229
-
230
-
231
-
232
-
233
-
234
-
235
-
236
-
237
-
238
-
239
-
240
-
241
-
242
-
243
-
244
-
245
-
246
-
247
-
248
-
249
-
250
-
251
-
252
-
253
-
254
-
255
-
256
-
257
-
258
-
259
-
260
-
261
-
262
-
263
-
264
-
265
-
266
-
267
-
268
-
269
-
270
-
271
-
272
 |
 |

34 Bank of America 2014
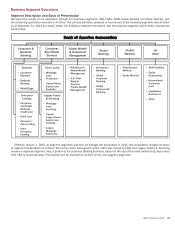
with less than $250,000 in investable assets. Merrill Edge
provides investment advice and guidance, client brokerage asset
services, a self-directed online investing platform and key banking
capabilities including access to the Corporation’s network of
banking centers and ATMs.
Business Banking within Deposits provides a wide range of
lending-related products and services, integrated working capital
management and treasury solutions to clients through our network
of offices and client relationship teams along with various product
partners. Our clients include U.S.-based companies generally with
annual sales of $1 million to $50 million. Our lending products
and services include commercial loans, lines of credit and real
estate lending. Our capital management and treasury solutions
include treasury management, foreign exchange and short-term
investing options. Deposits also includes the results of our
merchant services joint venture.
Deposits includes the net impact of migrating customers and
their related deposit balances between Deposits and GWIM as
well as other client-managed businesses. For more information on
the migration of customer balances to or from GWIM, see GWIM
on page 39.
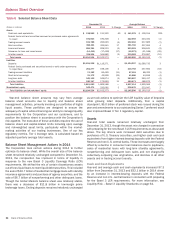
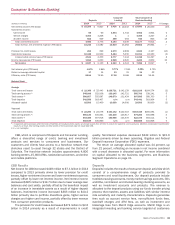
Net income for Deposits increased $724 million to $2.8 billion
in 2014 driven by higher revenue and a decrease in noninterest
expense. Net interest income increased $452 million to $10.3
billion primarily driven by a combination of pricing discipline and
the beneficial impact of an increase in investable assets as a
result of higher deposit balances. Noninterest income increased
$209 million to $5.0 billion primarily due to higher deposit service
charges.
The provision for credit losses decreased $45 million to $254
million as a result of improvement in credit quality. Noninterest
expense decreased $482 million to $10.4 billion due to lower
operating expenses, driven in part by a reduction in banking centers
as customers migrate to self-service touchpoints, in addition to
lower FDIC and litigation expense.
Average deposits increased $24.2 billion to $542.6 billion in
2014 driven by a continuing customer shift to more liquid products
in the low rate environment. Growth in checking, traditional savings
and money market savings of $34.7 billion was partially offset by
a decline in time deposits of $10.5 billion. As a result of our
continued pricing discipline and the shift in the mix of deposits,
the rate paid on average deposits declined by five bps to six bps.
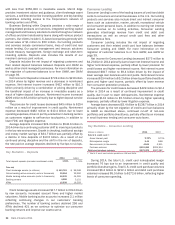
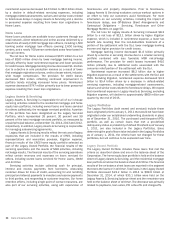
Key Statistics – Deposits
2014 2013
Total deposit spreads (excludes noninterest costs) 1.59% 1.52%
Year end
Client brokerage assets (in millions) $ 113,763 $ 96,048
Online banking active accounts (units in thousands) 30,904 29,950
Mobile banking active accounts (units in thousands) 16,539 14,395
Banking centers 4,855 5,151
ATMs 15,838 16,259
Client brokerage assets increased $17.7 billion in 2014 driven
by new accounts, increased account flows and higher market
valuations. Mobile banking active accounts increased 2.1 million
reflecting continuing changes in our customers’ banking
preferences. The number of banking centers declined 296 and
ATMs declined 421 as we continue to optimize our consumer
banking network and improve our cost-to-serve.
Consumer Lending
Consumer Lending is one of the leading issuers of credit and debit
cards to consumers and small businesses in the U.S. Our lending
products and services also include direct and indirect consumer
loans such as automotive, marine, aircraft, recreational vehicle
and consumer personal loans. In addition to earning net interest
spread revenue on its lending activities, Consumer Lending
generates interchange revenue from credit and debit card
transactions as well as annual credit card fees and other
miscellaneous fees.
Consumer Lending includes the net impact of migrating
customers and their related credit card loan balances between
Consumer Lending and GWIM. For more information on the
migration of customer balances to or from GWIM, see GWIM on
page 39.
Net income for Consumer Lending decreased $275 million to
$4.2 billion in 2014 primarily due to lower net interest income and
higher noninterest expense, partially offset by lower provision for
credit losses and higher noninterest income. Net interest income
decreased $817 million to $9.4 billion driven by the impact of
lower average loan balances and card yields. Noninterest income
increased $154 million to $5.2 billion driven by portfolio divestiture
gains and higher card income, partially offset by lower revenue
from consumer protection products.
The provision for credit losses decreased $429 million to $2.4
billion in 2014 as a result of continued improvement in credit
quality, due in part to lower delinquencies. Noninterest expense
increased $133 million to $5.5 billion driven by higher operating
expenses, partially offset by lower litigation expense.
Average loans decreased $3.4 billion to $138.7 billion in 2014
primarily driven by the net migration of credit card loan balances
to GWIM as described above, continued run-off of non-core
portfolios and portfolio divestitures, partially offset by an increase
in small business lending and consumer auto loans.
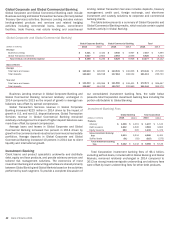
Key Statistics – Consumer Lending
(Dollars in millions) 2014 2013
Total U.S. credit card (1)
Gross interest yield 9.34% 9.73%
Risk-adjusted margin 9.44 8.68
New accounts (in thousands) 4,541 3,911
Purchase volumes $ 212,088 $205,914
Debit card purchase volumes $ 272,576 $267,087
(1) Total U.S. credit card includes portfolios in CBB and GWIM.
During 2014, the total U.S. credit card risk-adjusted margin
increased 76 bps due to an improvement in credit quality and
portfolio divestiture gains. Total U.S. credit card purchase volumes
increased $6.2 billion to $212.1 billion and debit card purchase
volumes increased $5.5 billion to $272.6 billion, reflecting higher
levels of consumer spending.