Bank of America 2014 Annual Report Download - page 262
Download and view the complete annual report
Please find page 262 of the 2014 Bank of America annual report below. You can navigate through the pages in the report by either clicking on the pages listed below, or by using the keyword search tool below to find specific information within the annual report.-
 1
1 -
2
-
3
-
4
-
5
-
6
-
7
-
8
-
9
-
10
-
11
-
12
-
13
-
14
-
15
-
16
-
17
-
18
-
19
-
20
-
21
-
22
-
23
-
24
-
25
-
26
-
27
-
28
-
29
-
30
-
31
-
32
-
33
-
34
-
35
-
36
-
37
-
38
-
39
-
40
-
41
-
42
-
43
-
44
-
45
-
46
-
47
-
48
-
49
-
50
-
51
-
52
-
53
-
54
-
55
-
56
-
57
-
58
-
59
-
60
-
61
-
62
-
63
-
64
-
65
-
66
-
67
-
68
-
69
-
70
-
71
-
72
-
73
-
74
-
75
-
76
-
77
-
78
-
79
-
80
-
81
-
82
-
83
-
84
-
85
-
86
-
87
-
88
-
89
-
90
-
91
-
92
-
93
-
94
-
95
-
96
-
97
-
98
-
99
-
100
-
101
-
102
-
103
-
104
-
105
-
106
-
107
-
108
-
109
-
110
-
111
-
112
-
113
-
114
-
115
-
116
-
117
-
118
-
119
-
120
-
121
-
122
-
123
-
124
-
125
-
126
-
127
-
128
-
129
-
130
-
131
-
132
-
133
-
134
-
135
-
136
-
137
-
138
-
139
-
140
-
141
-
142
-
143
-
144
-
145
-
146
-
147
-
148
-
149
-
150
-
151
-
152
-
153
-
154
-
155
-
156
-
157
-
158
-
159
-
160
-
161
-
162
-
163
-
164
-
165
-
166
-
167
-
168
-
169
-
170
-
171
-
172
-
173
-
174
-
175
-
176
-
177
-
178
-
179
-
180
-
181
-
182
-
183
-
184
-
185
-
186
-
187
-
188
-
189
-
190
-
191
-
192
-
193
-
194
-
195
-
196
-
197
-
198
-
199
-
200
-
201
-
202
-
203
-
204
-
205
-
206
-
207
-
208
-
209
-
210
-
211
-
212
-
213
-
214
-
215
-
216
-
217
-
218
-
219
-
220
-
221
-
222
-
223
-
224
-
225
-
226
-
227
-
228
-
229
-
230
-
231
-
232
-
233
-
234
-
235
-
236
-
237
-
238
-
239
-
240
-
241
-
242
-
243
-
244
-
245
-
246
-
247
-
248
-
249
-
250
-
251
-
 252
252 -
 253
253 -
 254
254 -
 255
255 -
 256
256 -
 257
257 -
 258
258 -
 259
259 -
 260
260 -
 261
261 -
 262
262 -
 263
263 -
 264
264 -
 265
265 -
 266
266 -
 267
267 -
 268
268 -
 269
269 -
 270
270 -
 271
271 -
 272
272
 |
 |

260 Bank of America 2014
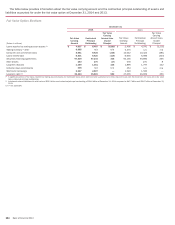
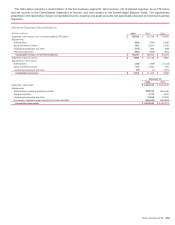
The table below presents net income (loss) and the components thereto (with net interest income on an FTE basis) for 2014, 2013
and 2012, and total assets at December 31, 2014 and 2013 for each business segment, as well as All Other.
Business Segments
At and for the Year Ended December 31 Total Corporation (1) Consumer & Business Banking Consumer Real Estate Services
(Dollars in millions) 2014 2013 2012 2014 2013 2012 2014 2013 2012
Net interest income (FTE basis) $ 40,821 $ 43,124 $ 41,557 $ 19,685 $ 20,050 $ 19,853 $ 2,831 $ 2,890 $ 2,928
Noninterest income 44,295 46,677 42,678 10,177 9,814 9,932 2,017 4,825 5,821
Total revenue, net of interest expense (FTE basis) 85,116 89,801 84,235 29,862 29,864 29,785 4,848 7,715 8,749
Provision for credit losses 2,275 3,556 8,169 2,633 3,107 4,148 160 (156) 1,442
Amortization of intangibles 936 1,086 1,264 398 505 626 ———
Other noninterest expense 74,181 68,128 70,829 15,513 15,755 16,295 23,226 15,815 16,968
Income (loss) before income taxes (FTE basis) 7,724 17,031 3,973 11,318 10,497 8,716 (18,538) (7,944) (9,661)
Income tax expense (benefit) (FTE basis) 2,891 5,600 (215) 4,222 3,850 3,126 (5,143)(2,913) (3,360)
Net income (loss) $ 4,833 $ 11,431 $ 4,188 $ 7,096 $ 6,647 $ 5,590 $ (13,395) $ (5,031) $ (6,301)
Year-end total assets $ 2,104,534 $2,102,273 $ 622,378 $593,014 $ 103,730 $113,391
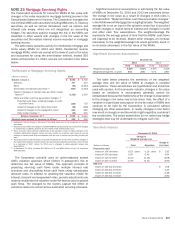
Global Wealth &
Investment Management Global Banking
2014 2013 2012 2014 2013 2012
Net interest income (FTE basis) $ 5,836 $ 6,064 $ 5,827 $ 8,999 $ 8,914 $ 8,131
Noninterest income 12,568 11,726 10,691 7,599 7,565 7,538
Total revenue, net of interest expense (FTE basis) 18,404 17,790 16,518 16,598 16,479 15,669
Provision for credit losses 14 56 266 336 1,075 (342)
Amortization of intangibles 367 387 410 45 62 79
Other noninterest expense 13,280 12,646 12,312 7,636 7,489 7,538
Income before income taxes (FTE basis) 4,743 4,701 3,530 8,581 7,853 8,394
Income tax expense (FTE basis) 1,769 1,724 1,286 3,146 2,880 3,052
Net income $ 2,974 $ 2,977 $ 2,244 $ 5,435 $ 4,973 $ 5,342
Year-end total assets $ 276,587 $274,113 $ 379,513 $378,659
Global Markets All Other
2014 2013 2012 2014 2013 2012
Net interest income (FTE basis) $ 3,986 $ 4,224 $ 3,667 $ (516) $ 982 $ 1,151
Noninterest income 12,133 11,166 5,507 (199) 1,581 3,189
Total revenue, net of interest expense (FTE basis) 16,119 15,390 9,174 (715) 2,563 4,340
Provision for credit losses 110 140 34 (978) (666) 2,621
Amortization of intangibles 65 65 64 61 67 85
Other noninterest expense 11,706 11,931 11,221 2,820 4,492 6,495
Income (loss) before income taxes (FTE basis) 4,238 3,254 (2,145) (2,618)(1,330) (4,861)
Income tax expense (benefit) (FTE basis) 1,519 2,101 (161) (2,622)(2,042) (4,158)
Net income (loss) $ 2,719 $ 1,153 $ (1,984) $4
$ 712 $ (703)
Year-end total assets $ 579,514 $575,472 $ 142,812 $167,624
(1) There were no material intersegment revenues.