Bank of America 2014 Annual Report Download - page 96
Download and view the complete annual report
Please find page 96 of the 2014 Bank of America annual report below. You can navigate through the pages in the report by either clicking on the pages listed below, or by using the keyword search tool below to find specific information within the annual report.-
 1
1 -
2
-
3
-
4
-
5
-
6
-
7
-
8
-
9
-
10
-
11
-
12
-
13
-
14
-
15
-
16
-
17
-
18
-
19
-
20
-
21
-
22
-
23
-
24
-
25
-
26
-
27
-
28
-
29
-
30
-
31
-
32
-
33
-
34
-
35
-
36
-
37
-
38
-
39
-
40
-
41
-
42
-
43
-
44
-
45
-
46
-
47
-
48
-
49
-
50
-
51
-
52
-
53
-
54
-
55
-
56
-
57
-
58
-
59
-
60
-
61
-
62
-
63
-
64
-
65
-
66
-
67
-
68
-
69
-
70
-
71
-
72
-
73
-
74
-
75
-
76
-
77
-
78
-
79
-
80
-
81
-
82
-
83
-
84
-
85
-
 86
86 -
 87
87 -
 88
88 -
 89
89 -
 90
90 -
 91
91 -
 92
92 -
 93
93 -
 94
94 -
 95
95 -
 96
96 -
 97
97 -
 98
98 -
 99
99 -
 100
100 -
 101
101 -
 102
102 -
 103
103 -
 104
104 -
 105
105 -
 106
106 -
107
-
108
-
109
-
110
-
111
-
112
-
113
-
114
-
115
-
116
-
117
-
118
-
119
-
120
-
121
-
122
-
123
-
124
-
125
-
126
-
127
-
128
-
129
-
130
-
131
-
132
-
133
-
134
-
135
-
136
-
137
-
138
-
139
-
140
-
141
-
142
-
143
-
144
-
145
-
146
-
147
-
148
-
149
-
150
-
151
-
152
-
153
-
154
-
155
-
156
-
157
-
158
-
159
-
160
-
161
-
162
-
163
-
164
-
165
-
166
-
167
-
168
-
169
-
170
-
171
-
172
-
173
-
174
-
175
-
176
-
177
-
178
-
179
-
180
-
181
-
182
-
183
-
184
-
185
-
186
-
187
-
188
-
189
-
190
-
191
-
192
-
193
-
194
-
195
-
196
-
197
-
198
-
199
-
200
-
201
-
202
-
203
-
204
-
205
-
206
-
207
-
208
-
209
-
210
-
211
-
212
-
213
-
214
-
215
-
216
-
217
-
218
-
219
-
220
-
221
-
222
-
223
-
224
-
225
-
226
-
227
-
228
-
229
-
230
-
231
-
232
-
233
-
234
-
235
-
236
-
237
-
238
-
239
-
240
-
241
-
242
-
243
-
244
-
245
-
246
-
247
-
248
-
249
-
250
-
251
-
252
-
253
-
254
-
255
-
256
-
257
-
258
-
259
-
260
-
261
-
262
-
263
-
264
-
265
-
266
-
267
-
268
-
269
-
270
-
271
-
272
 |
 |

94 Bank of America 2014
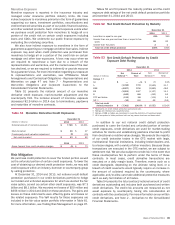
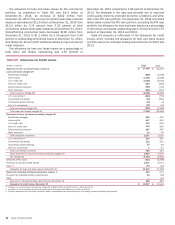
The allowance for loan and lease losses for the commercial
portfolio, as presented in Table 60, was $4.4 billion at
December 31, 2014, an increase of $432 million from
December 31, 2013. The commercial utilized reservable criticized
exposure decreased to $11.6 billion at December 31, 2014 from
$12.9 billion (to 2.74 percent from 3.02 percent of total
commercial utilized reservable exposure) at December 31, 2013.
Nonperforming commercial loans decreased $196 million from
December 31, 2013 to $1.1 billion (to 0.29 percent from 0.34
percent of outstanding commercial loans) at December 31, 2014.
See Tables 41, 42 and 44 for additional details on key commercial
credit statistics.
The allowance for loan and lease losses as a percentage of
total loans and leases outstanding was 1.65 percent at
December 31, 2014 compared to 1.90 percent at December 31,
2013. The decrease in the ratio was primarily due to improved
credit quality driven by improved economic conditions and write-
offs in the PCI loan portfolio. The December 31, 2014 and 2013
ratios above include the PCI loan portfolio. Excluding the PCI loan
portfolio, the allowance for loan and lease losses as a percentage
of total loans and leases outstanding was 1.50 percent and 1.67
percent at December 31, 2014 and 2013.
Table 59 presents a rollforward of the allowance for credit
losses, which includes the allowance for loan and lease losses
and the reserve for unfunded lending commitments, for 2014 and
2013.
Table 59 Allowance for Credit Losses
(Dollars in millions) 2014 2013
Allowance for loan and lease losses, January 1 $ 17,428 $ 24,179
Loans and leases charged off
Residential mortgage (855)(1,508)
Home equity (1,364)(2,258)
U.S. credit card (3,068)(4,004)
Non-U.S. credit card (357)(508)
Direct/Indirect consumer (456)(710)
Other consumer (268)(273)
Total consumer charge-offs (6,368)(9,261)
U.S. commercial (1) (584)(774)
Commercial real estate (29) (251)
Commercial lease financing (10) (4)
Non-U.S. commercial (35) (79)
Total commercial charge-offs (658)(1,108)
Total loans and leases charged off (7,026)(10,369)
Recoveries of loans and leases previously charged off
Residential mortgage 969 424
Home equity 457 455
U.S. credit card 430 628
Non-U.S. credit card 115 109
Direct/Indirect consumer 287 365
Other consumer 39 39
Total consumer recoveries 2,297 2,020
U.S. commercial (2) 214 287
Commercial real estate 112 102
Commercial lease financing 19 29
Non-U.S. commercial 134
Total commercial recoveries 346 452
Total recoveries of loans and leases previously charged off 2,643 2,472
Net charge-offs (4,383)(7,897)
Write-offs of PCI loans (810)(2,336)
Provision for loan and lease losses 2,231 3,574
Other (3) (47) (92)
Allowance for loan and lease losses, December 31 14,419 17,428
Reserve for unfunded lending commitments, January 1 484 513
Provision for unfunded lending commitments 44 (18)
Other —(11)
Reserve for unfunded lending commitments, December 31 528 484
Allowance for credit losses, December 31 $ 14,947 $ 17,912
(1) Includes U.S. small business commercial charge-offs of $345 million and $457 million in 2014 and 2013.
(2) Includes U.S. small business commercial recoveries of $63 million and $98 million in 2014 and 2013.
(3) Primarily represents the net impact of portfolio sales, consolidations and deconsolidations, and foreign currency translation adjustments.