Bank of America 2014 Annual Report Download - page 93
Download and view the complete annual report
Please find page 93 of the 2014 Bank of America annual report below. You can navigate through the pages in the report by either clicking on the pages listed below, or by using the keyword search tool below to find specific information within the annual report.-
 1
1 -
2
-
3
-
4
-
5
-
6
-
7
-
8
-
9
-
10
-
11
-
12
-
13
-
14
-
15
-
16
-
17
-
18
-
19
-
20
-
21
-
22
-
23
-
24
-
25
-
26
-
27
-
28
-
29
-
30
-
31
-
32
-
33
-
34
-
35
-
36
-
37
-
38
-
39
-
40
-
41
-
42
-
43
-
44
-
45
-
46
-
47
-
48
-
49
-
50
-
51
-
52
-
53
-
54
-
55
-
56
-
57
-
58
-
59
-
60
-
61
-
62
-
63
-
64
-
65
-
66
-
67
-
68
-
69
-
70
-
71
-
72
-
73
-
74
-
75
-
76
-
77
-
78
-
79
-
80
-
81
-
82
-
 83
83 -
 84
84 -
 85
85 -
 86
86 -
 87
87 -
 88
88 -
 89
89 -
 90
90 -
 91
91 -
 92
92 -
 93
93 -
 94
94 -
 95
95 -
 96
96 -
 97
97 -
 98
98 -
 99
99 -
 100
100 -
 101
101 -
 102
102 -
 103
103 -
104
-
105
-
106
-
107
-
108
-
109
-
110
-
111
-
112
-
113
-
114
-
115
-
116
-
117
-
118
-
119
-
120
-
121
-
122
-
123
-
124
-
125
-
126
-
127
-
128
-
129
-
130
-
131
-
132
-
133
-
134
-
135
-
136
-
137
-
138
-
139
-
140
-
141
-
142
-
143
-
144
-
145
-
146
-
147
-
148
-
149
-
150
-
151
-
152
-
153
-
154
-
155
-
156
-
157
-
158
-
159
-
160
-
161
-
162
-
163
-
164
-
165
-
166
-
167
-
168
-
169
-
170
-
171
-
172
-
173
-
174
-
175
-
176
-
177
-
178
-
179
-
180
-
181
-
182
-
183
-
184
-
185
-
186
-
187
-
188
-
189
-
190
-
191
-
192
-
193
-
194
-
195
-
196
-
197
-
198
-
199
-
200
-
201
-
202
-
203
-
204
-
205
-
206
-
207
-
208
-
209
-
210
-
211
-
212
-
213
-
214
-
215
-
216
-
217
-
218
-
219
-
220
-
221
-
222
-
223
-
224
-
225
-
226
-
227
-
228
-
229
-
230
-
231
-
232
-
233
-
234
-
235
-
236
-
237
-
238
-
239
-
240
-
241
-
242
-
243
-
244
-
245
-
246
-
247
-
248
-
249
-
250
-
251
-
252
-
253
-
254
-
255
-
256
-
257
-
258
-
259
-
260
-
261
-
262
-
263
-
264
-
265
-
266
-
267
-
268
-
269
-
270
-
271
-
272
 |
 |

Bank of America 2014 91
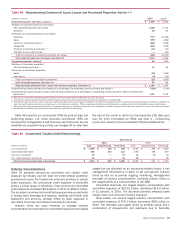
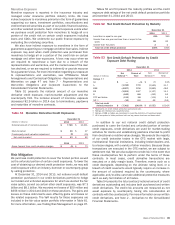
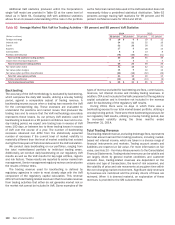
Table 57 presents our 20 largest non-U.S. country exposures.
These exposures accounted for 88 percent of our total non-U.S.
exposure at both December 31, 2014 and 2013. Net country
exposure for these 20 countries increased $13.6 billion in 2014
driven by higher funded and unfunded loans and loan equivalents
exposure in Japan and Hong Kong, increased derivatives exposure
in the United Kingdom, Japan, Hong Kong and Germany, and
increased trading securities exposure in the United Kingdom, Italy
and India. These increases were partially offset by reductions in
funded and unfunded loans and loan equivalents exposure in
Russia, the United Kingdom, Australia and Italy, and decreases in
securities exposure in Germany and Japan.
Funded loans and loan equivalents include loans, leases, and
other extensions of credit and funds, including letters of credit and
due from placements, which have not been reduced by collateral,
hedges or credit default protection. Funded loans and loan
equivalents are reported net of charge-offs but prior to any
allowance for loan and lease losses. Unfunded commitments are
the undrawn portion of legally binding commitments related to
loans and loan equivalents.
Net counterparty exposure includes the fair value of derivatives,
including the counterparty risk associated with credit default
swaps (CDS), and secured financing transactions. Derivatives
exposures are presented net of collateral, which is predominantly
cash, pledged under legally enforceable master netting
agreements. Secured financing transaction exposures are
presented net of eligible cash or securities pledged as collateral.
Securities and other investments are carried at fair value and
long securities exposures are netted against short exposures with
the same underlying issuer to, but not below, zero (i.e., negative
issuer exposures are reported as zero). Other investments include
our GPI portfolio and strategic investments.
Net country exposure represents country exposure less hedges
and credit default protection purchased, net of credit default
protection sold. We hedge certain of our country exposures with
credit default protection primarily in the form of single-name, as
well as indexed and tranched CDS. The exposures associated with
these hedges represent the amount that would be realized upon
the isolated default of an individual issuer in the relevant country
assuming a zero recovery rate for that individual issuer, and are
calculated based on the CDS notional amount adjusted for any
fair value receivable or payable. Changes in the assumption of an
isolated default can produce different results in a particular
tranche.
Table 57 Top 20 Non-U.S. Countries Exposure
(Dollars in millions)
Funded Loans
and Loan
Equivalents
Unfunded
Loan
Commitments
Net
Counterparty
Exposure
Securities/
Other
Investments
Country
Exposure at
December 31
2014
Hedges and
Credit Default
Protection
Net Country
Exposure at
December 31
2014
Increase
(Decrease) from
December 31
2013
United Kingdom $ 23,727 $ 11,921 $ 6,373 $ 7,769 $ 49,790 $ (4,243) $45,547 $ 1,961
Canada 6,388 6,847 1,950 5,173 20,358 (1,818) 18,540 129
Japan 12,518 506 3,589 1,453 18,066 (1,332) 16,734 8,619
Brazil 9,923 727 511 4,183 15,344 (360) 14,984 1,352
Germany 5,341 5,840 3,477 1,489 16,147 (3,588) 12,559 (159)
China 10,238 725 556 1,483 13,002 (710) 12,292 (629)
India 5,631 507 496 4,126 10,760 (174) 10,586 335
France 3,246 5,117 1,495 5,038 14,896 (4,458) 10,438 275
Hong Kong 6,413 616 924 691 8,644 (36) 8,608 3,251
Netherlands 2,928 3,392 675 2,275 9,270 (1,135) 8,135 500
Australia 3,237 1,908 826 2,235 8,206 (533) 7,673 (324)
Switzerland 2,493 3,663 1,018 622 7,796 (1,265) 6,531 985
South Korea 3,559 707 534 2,327 7,127 (678) 6,449 14
Italy 2,545 1,596 2,484 1,752 8,377 (2,978) 5,399 197
Mexico 3,038 807 245 566 4,656 (385) 4,271 272
Singapore 1,984 203 673 1,206 4,066 (62) 4,004 175
Taiwan 2,248 — 437 1,180 3,865 — 3,865 (207)
Spain 2,296 994 296 1,022 4,608 (992) 3,616 213
Russia 4,124 80 732 66 5,002 (1,393) 3,609 (3,113)
Turkey 2,695 75 15 185 2,970 (482) 2,488 (205)
Total top 20 non-U.S.
countries exposure $ 114,572 $ 46,231 $ 27,306 $ 44,841 $ 232,950 $ (26,622) $ 206,328 $ 13,641
Russian intervention in Ukraine during 2014 significantly
increased regional geopolitical tensions. The Russian economy is
slowing due to the negative impacts of weak oil prices, ongoing
economic sanctions and high interest rates resulting from Russian
central bank actions taken to counter ruble depreciation. Net
exposure to Russia was reduced to $3.6 billion at December 31,
2014, concentrated in oil and gas companies and commercial
banks. Our exposure to Ukraine at December 31, 2014 was
minimal. In response to Russian actions, U.S. and European
governments have imposed sanctions on a limited number of
Russian individuals and business entities. Geopolitical and
economic conditions remain fluid with potential for further
escalation of tensions, severity of sanctions against Russian
interests, sustained low oil prices and rating agency downgrades.
Certain European countries, including Italy, Spain, Ireland,
Greece and Portugal, have experienced varying degrees of financial
stress in recent years. While market conditions have improved in
Europe, policymakers continue to address fundamental challenges
of competitiveness, growth, deflation and high unemployment. A
return of political stress or financial instability in these countries
could disrupt financial markets and have a detrimental impact on
global economic conditions and sovereign and non-sovereign debt