Bank of America 2014 Annual Report Download - page 60
Download and view the complete annual report
Please find page 60 of the 2014 Bank of America annual report below. You can navigate through the pages in the report by either clicking on the pages listed below, or by using the keyword search tool below to find specific information within the annual report.-
 1
1 -
2
-
3
-
4
-
5
-
6
-
7
-
8
-
9
-
10
-
11
-
12
-
13
-
14
-
15
-
16
-
17
-
18
-
19
-
20
-
21
-
22
-
23
-
24
-
25
-
26
-
27
-
28
-
29
-
30
-
31
-
32
-
33
-
34
-
35
-
36
-
37
-
38
-
39
-
40
-
41
-
42
-
43
-
44
-
45
-
46
-
47
-
48
-
49
-
 50
50 -
 51
51 -
 52
52 -
 53
53 -
 54
54 -
 55
55 -
 56
56 -
 57
57 -
 58
58 -
 59
59 -
 60
60 -
 61
61 -
 62
62 -
 63
63 -
 64
64 -
 65
65 -
 66
66 -
 67
67 -
 68
68 -
 69
69 -
 70
70 -
71
-
72
-
73
-
74
-
75
-
76
-
77
-
78
-
79
-
80
-
81
-
82
-
83
-
84
-
85
-
86
-
87
-
88
-
89
-
90
-
91
-
92
-
93
-
94
-
95
-
96
-
97
-
98
-
99
-
100
-
101
-
102
-
103
-
104
-
105
-
106
-
107
-
108
-
109
-
110
-
111
-
112
-
113
-
114
-
115
-
116
-
117
-
118
-
119
-
120
-
121
-
122
-
123
-
124
-
125
-
126
-
127
-
128
-
129
-
130
-
131
-
132
-
133
-
134
-
135
-
136
-
137
-
138
-
139
-
140
-
141
-
142
-
143
-
144
-
145
-
146
-
147
-
148
-
149
-
150
-
151
-
152
-
153
-
154
-
155
-
156
-
157
-
158
-
159
-
160
-
161
-
162
-
163
-
164
-
165
-
166
-
167
-
168
-
169
-
170
-
171
-
172
-
173
-
174
-
175
-
176
-
177
-
178
-
179
-
180
-
181
-
182
-
183
-
184
-
185
-
186
-
187
-
188
-
189
-
190
-
191
-
192
-
193
-
194
-
195
-
196
-
197
-
198
-
199
-
200
-
201
-
202
-
203
-
204
-
205
-
206
-
207
-
208
-
209
-
210
-
211
-
212
-
213
-
214
-
215
-
216
-
217
-
218
-
219
-
220
-
221
-
222
-
223
-
224
-
225
-
226
-
227
-
228
-
229
-
230
-
231
-
232
-
233
-
234
-
235
-
236
-
237
-
238
-
239
-
240
-
241
-
242
-
243
-
244
-
245
-
246
-
247
-
248
-
249
-
250
-
251
-
252
-
253
-
254
-
255
-
256
-
257
-
258
-
259
-
260
-
261
-
262
-
263
-
264
-
265
-
266
-
267
-
268
-
269
-
270
-
271
-
272
 |
 |

58 Bank of America 2014
or clarification by U.S. banking regulators or as our understanding
and interpretation of the rules evolve. Actual results could differ
from those estimates and assumptions.
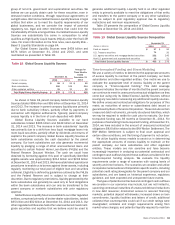
Advanced Approaches
In addition to the exposures calculated under the Basel 3
Standardized approach, the Basel 3 Advanced approaches include
measures of operational risk and risks related to the credit
valuation adjustment (CVA) for over-the-counter (OTC) derivative
exposures. The Advanced approaches rely on internal analytical
models to measure risk weights for credit risk exposures and allow
the use of models to estimate the exposure at default (EAD) for
certain exposure types. Market risk capital measurements are
consistent with the Standardized approach, except for
securitization exposures, where the Supervisory Formula Approach
is also permitted. Credit risk exposures are measured using
internal ratings-based models to determine the applicable risk
weight by estimating the probability of default, loss-given default
(LGD) and, in certain instances, EAD. The internal analytical models
primarily rely on internal historical default and loss experience.
Operational risk is measured using internal analytical models
which rely on both internal and external operational loss
experience and data. The calculations under Basel 3 require
management to make estimates, assumptions and
interpretations, including with respect to the probability of future
events based on historical experience. Actual results could differ
from those estimates and assumptions.
The Basel 3 Advanced approaches require approval by the U.S.
banking regulators of our internal analytical models used to
calculate risk-weighted assets. We estimate our Common equity
tier 1 capital ratio under the Basel 3 Advanced approaches, on a
fully phased-in basis, would have been 9.6 percent at
December 31, 2014. As of December 31, 2014, we estimate that
our Basel 3 Advanced Common equity tier 1 capital would have
been $141.2 billion and total risk-weighted assets would have
been $1,465 billion, on a fully phased-in basis. These estimates
assume approval by U.S. banking regulators of our internal
analytical models, and do not include the benefit of the removal
of the surcharge applicable to the CRM. Our estimates under the
Basel 3 Advanced approaches may be refined over time as a result
of further rulemaking or clarification by U.S. banking regulators or
as our understanding and interpretation of the rules evolve. We
are currently working with the U.S. banking regulators to obtain
approval of certain internal analytical models including the
wholesale (e.g., commercial) and other credit models in order to
exit parallel run. The U.S. banking regulators have indicated that
they will require modifications to these models which would likely
result in a material increase in our risk-weighted assets resulting
in a decrease in our capital ratios.
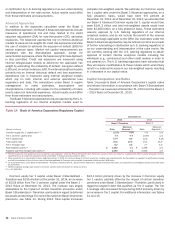
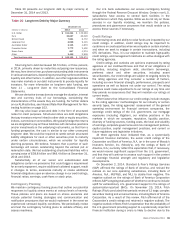
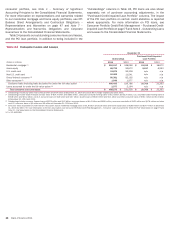
Capital Composition and Ratios
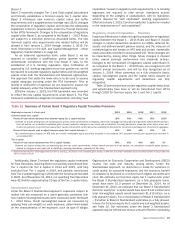
Table 14 presents Bank of America Corporation’s capital ratios
and related information in accordance with Basel 3 Standardized
– Transition as measured at December 31, 2014 and the Basel 1
– 2013 Rules at December 31, 2013.
Table 14 Bank of America Corporation Regulatory Capital
December 31
2014 2013
Basel 3 Transition Basel 1
(Dollars in billions) Ratio
Minimum
Required (1) Ratio
Minimum
Required (1)
Common equity tier 1 capital ratio (2, 3) 12.3%4.0% n/a n/a
Tier 1 common capital ratio n/a n/a 10.9% n/a
Tier 1 capital ratio 13.4 6.0 12.2 6.0%
Total capital ratio 16.5 10.0 15.1 10.0
Tier 1 leverage ratio 8.2 5.0 7.7 5.0
Risk-weighted assets (3) $ 1,262 n/a $ 1,298 n/a
Adjusted quarterly average total assets (4) 2,060 n/a 2,052 n/a
(1) Percent required to meet guidelines to be considered “well capitalized” under the Prompt Corrective Action framework, except for Common equity tier 1 capital which reflects capital adequacy minimum
requirements as an advanced approaches bank under Basel 3 during a transition period in 2014.
(2) When presented on a fully phased-in basis, beginning January 1, 2019, the minimum Basel 3 Common equity tier 1 capital ratio requirement for the Corporation is expected to significantly increase
and will be comprised of the minimum ratio of the then-applicable 4.5 percent, plus a capital conservation buffer and the GSIB buffer.
(3) On a pro-forma basis, under Basel 3 Standardized – Transition, the December 31, 2013 Common equity tier 1 capital ratio would have been 11.6 percent and risk-weighted assets would have been
$1,316 billion.
(4) Reflects adjusted average total assets for the three months ended December 31, 2014 and 2013.
n/a = not applicable
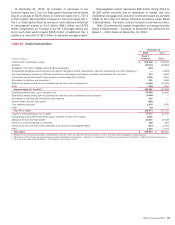
Common equity tier 1 capital under Basel 3 Standardized –
Transition was $155.4 billion at December 31, 2014, an increase
of $13.8 billion from Tier 1 common capital under the Basel 1 –
2013 Rules at December 31, 2013. The increase was largely
attributable to the impact of certain transition provisions under
Basel 3 Standardized – Transition, particularly in regard to deferred
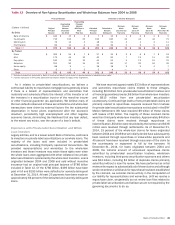
tax assets and earnings. For more information on Basel 3 transition
provisions, see Table 13. During 2014, Total capital increased
$12.1 billion primarily driven by the increase in Common equity
tier 1 capital, partially offset by the impact of certain transition
provisions under Basel 3 Standardized – Transition, particularly in
regard to long-term debt that qualifies as Tier 2 capital. The Tier
1 leverage ratio increased 52 bps during 2014 primarily driven by
an increase in Tier 1 capital. For additional information, see Tables
14 and 15.