Bank of America 2014 Annual Report Download - page 174
Download and view the complete annual report
Please find page 174 of the 2014 Bank of America annual report below. You can navigate through the pages in the report by either clicking on the pages listed below, or by using the keyword search tool below to find specific information within the annual report.-
 1
1 -
2
-
3
-
4
-
5
-
6
-
7
-
8
-
9
-
10
-
11
-
12
-
13
-
14
-
15
-
16
-
17
-
18
-
19
-
20
-
21
-
22
-
23
-
24
-
25
-
26
-
27
-
28
-
29
-
30
-
31
-
32
-
33
-
34
-
35
-
36
-
37
-
38
-
39
-
40
-
41
-
42
-
43
-
44
-
45
-
46
-
47
-
48
-
49
-
50
-
51
-
52
-
53
-
54
-
55
-
56
-
57
-
58
-
59
-
60
-
61
-
62
-
63
-
64
-
65
-
66
-
67
-
68
-
69
-
70
-
71
-
72
-
73
-
74
-
75
-
76
-
77
-
78
-
79
-
80
-
81
-
82
-
83
-
84
-
85
-
86
-
87
-
88
-
89
-
90
-
91
-
92
-
93
-
94
-
95
-
96
-
97
-
98
-
99
-
100
-
101
-
102
-
103
-
104
-
105
-
106
-
107
-
108
-
109
-
110
-
111
-
112
-
113
-
114
-
115
-
116
-
117
-
118
-
119
-
120
-
121
-
122
-
123
-
124
-
125
-
126
-
127
-
128
-
129
-
130
-
131
-
132
-
133
-
134
-
135
-
136
-
137
-
138
-
139
-
140
-
141
-
142
-
143
-
144
-
145
-
146
-
147
-
148
-
149
-
150
-
151
-
152
-
153
-
154
-
155
-
156
-
157
-
158
-
159
-
160
-
161
-
162
-
163
-
 164
164 -
 165
165 -
 166
166 -
 167
167 -
 168
168 -
 169
169 -
 170
170 -
 171
171 -
 172
172 -
 173
173 -
 174
174 -
 175
175 -
 176
176 -
 177
177 -
 178
178 -
 179
179 -
 180
180 -
 181
181 -
 182
182 -
 183
183 -
 184
184 -
185
-
186
-
187
-
188
-
189
-
190
-
191
-
192
-
193
-
194
-
195
-
196
-
197
-
198
-
199
-
200
-
201
-
202
-
203
-
204
-
205
-
206
-
207
-
208
-
209
-
210
-
211
-
212
-
213
-
214
-
215
-
216
-
217
-
218
-
219
-
220
-
221
-
222
-
223
-
224
-
225
-
226
-
227
-
228
-
229
-
230
-
231
-
232
-
233
-
234
-
235
-
236
-
237
-
238
-
239
-
240
-
241
-
242
-
243
-
244
-
245
-
246
-
247
-
248
-
249
-
250
-
251
-
252
-
253
-
254
-
255
-
256
-
257
-
258
-
259
-
260
-
261
-
262
-
263
-
264
-
265
-
266
-
267
-
268
-
269
-
270
-
271
-
272
 |
 |

172 Bank of America 2014
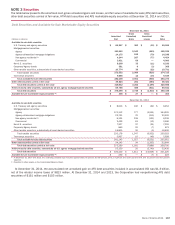
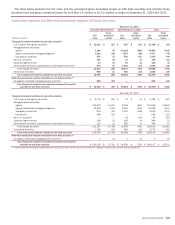
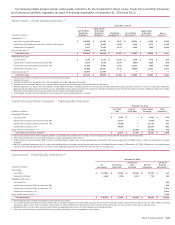
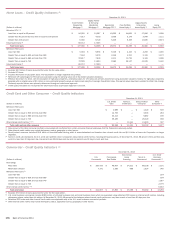
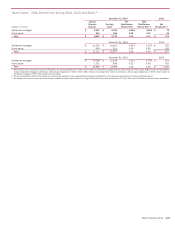
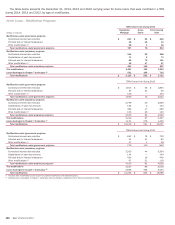
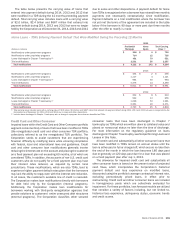
NOTE 4 Outstanding Loans and Leases
The following tables present total outstanding loans and leases and an aging analysis for the Corporation’s Home Loans, Credit Card
and Other Consumer, and Commercial portfolio segments, by class of financing receivables, at December 31, 2014 and 2013.
December 31, 2014
(Dollars in millions)
30-59 Days
Past Due (1)
60-89 Days
Past Due (1)
90 Days or
More
Past Due (2)
Total Past
Due 30
Days
or More
Total
Current or
Less Than
30 Days
Past Due (3)
Purchased
Credit-
impaired (4)
Loans
Accounted
for Under
the Fair
Value Option
Total
Outstandings
Home loans
Core portfolio
Residential mortgage $ 1,847 $ 700 $ 5,561 $ 8,108 $ 154,112 $ 162,220
Home equity 218 105 744 1,067 50,820 51,887
Legacy Assets & Servicing portfolio
Residential mortgage (5) 2,008 1,060 10,513 13,581 25,244 $ 15,152 53,977
Home equity 374 174 1,166 1,714 26,507 5,617 33,838
Credit card and other consumer
U.S. credit card 494 341 866 1,701 90,178 91,879
Non-U.S. credit card 49 39 95 183 10,282 10,465
Direct/Indirect consumer (6) 245 71 65 381 80,000 80,381
Other consumer (7) 11 2 2 15 1,831 1,846
Total consumer 5,246 2,492 19,012 26,750 438,974 20,769 486,493
Consumer loans accounted for under
the fair value option (8) $ 2,077 2,077
Total consumer loans and leases 5,246 2,492 19,012 26,750 438,974 20,769 2,077 488,570
Commercial
U.S. commercial 320 151 318 789 219,504 220,293
Commercial real estate (9) 138 16 288 442 47,240 47,682
Commercial lease financing 121 41 42 204 24,662 24,866
Non-U.S. commercial 5 4 — 9 80,074 80,083
U.S. small business commercial 88 45 94 227 13,066 13,293
Total commercial 672 257 742 1,671 384,546 386,217
Commercial loans accounted for under
the fair value option (8) 6,604 6,604
Total commercial loans and leases 672 257 742 1,671 384,546 6,604 392,821
Total loans and leases $ 5,918 $ 2,749 $ 19,754 $ 28,421 $ 823,520 $ 20,769 $ 8,681 $ 881,391
Percentage of outstandings 0.67% 0.31% 2.24% 3.22% 93.44% 2.36%0.98% 100.00%
(1) Home loans 30-59 days past due includes fully-insured loans of $2.1 billion and nonperforming loans of $392 million. Home loans 60-89 days past due includes fully-insured loans of $1.1 billion
and nonperforming loans of $332 million.
(2) Home loans includes fully-insured loans of $11.4 billion.
(3) Home loans includes $3.6 billion and direct/indirect consumer includes $27 million of nonperforming loans.
(4) PCI loan amounts are shown gross of the valuation allowance.
(5) Total outstandings includes pay option loans of $3.2 billion. The Corporation no longer originates this product.
(6) Total outstandings includes dealer financial services loans of $37.7 billion, unsecured consumer lending loans of $1.5 billion, U.S. securities-based lending loans of $35.8 billion, non-U.S. consumer
loans of $4.0 billion, student loans of $632 million and other consumer loans of $761 million.
(7) Total outstandings includes consumer finance loans of $676 million, consumer leases of $1.0 billion, consumer overdrafts of $162 million and other non-U.S. consumer loans of $3 million.
(8) Consumer loans accounted for under the fair value option were residential mortgage loans of $1.9 billion and home equity loans of $196 million. Commercial loans accounted for under the fair value
option were U.S. commercial loans of $1.9 billion and non-U.S. commercial loans of $4.7 billion. For additional information, see Note 20 – Fair Value Measurements and Note 21 – Fair Value Option.
(9) Total outstandings includes U.S. commercial real estate loans of $45.2 billion and non-U.S. commercial real estate loans of $2.5 billion.