Bank of America 2014 Annual Report Download - page 26
Download and view the complete annual report
Please find page 26 of the 2014 Bank of America annual report below. You can navigate through the pages in the report by either clicking on the pages listed below, or by using the keyword search tool below to find specific information within the annual report.-
 1
1 -
2
-
3
-
4
-
5
-
6
-
7
-
8
-
9
-
10
-
11
-
12
-
13
-
14
-
15
-
 16
16 -
 17
17 -
 18
18 -
 19
19 -
 20
20 -
 21
21 -
 22
22 -
 23
23 -
 24
24 -
 25
25 -
 26
26 -
 27
27 -
 28
28 -
 29
29 -
 30
30 -
 31
31 -
 32
32 -
 33
33 -
 34
34 -
 35
35 -
 36
36 -
37
-
38
-
39
-
40
-
41
-
42
-
43
-
44
-
45
-
46
-
47
-
48
-
49
-
50
-
51
-
52
-
53
-
54
-
55
-
56
-
57
-
58
-
59
-
60
-
61
-
62
-
63
-
64
-
65
-
66
-
67
-
68
-
69
-
70
-
71
-
72
-
73
-
74
-
75
-
76
-
77
-
78
-
79
-
80
-
81
-
82
-
83
-
84
-
85
-
86
-
87
-
88
-
89
-
90
-
91
-
92
-
93
-
94
-
95
-
96
-
97
-
98
-
99
-
100
-
101
-
102
-
103
-
104
-
105
-
106
-
107
-
108
-
109
-
110
-
111
-
112
-
113
-
114
-
115
-
116
-
117
-
118
-
119
-
120
-
121
-
122
-
123
-
124
-
125
-
126
-
127
-
128
-
129
-
130
-
131
-
132
-
133
-
134
-
135
-
136
-
137
-
138
-
139
-
140
-
141
-
142
-
143
-
144
-
145
-
146
-
147
-
148
-
149
-
150
-
151
-
152
-
153
-
154
-
155
-
156
-
157
-
158
-
159
-
160
-
161
-
162
-
163
-
164
-
165
-
166
-
167
-
168
-
169
-
170
-
171
-
172
-
173
-
174
-
175
-
176
-
177
-
178
-
179
-
180
-
181
-
182
-
183
-
184
-
185
-
186
-
187
-
188
-
189
-
190
-
191
-
192
-
193
-
194
-
195
-
196
-
197
-
198
-
199
-
200
-
201
-
202
-
203
-
204
-
205
-
206
-
207
-
208
-
209
-
210
-
211
-
212
-
213
-
214
-
215
-
216
-
217
-
218
-
219
-
220
-
221
-
222
-
223
-
224
-
225
-
226
-
227
-
228
-
229
-
230
-
231
-
232
-
233
-
234
-
235
-
236
-
237
-
238
-
239
-
240
-
241
-
242
-
243
-
244
-
245
-
246
-
247
-
248
-
249
-
250
-
251
-
252
-
253
-
254
-
255
-
256
-
257
-
258
-
259
-
260
-
261
-
262
-
263
-
264
-
265
-
266
-
267
-
268
-
269
-
270
-
271
-
272
 |
 |

24 Bank of America 2014
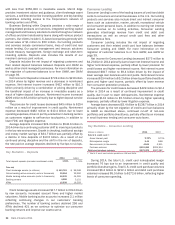
Balance Sheet Overview
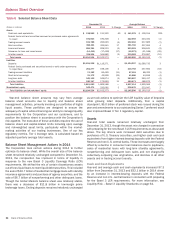
Table 6 Selected Balance Sheet Data
December 31 Average Balance
(Dollars in millions) 2014 2013 % Change 2014 2013 % Change
Assets
Cash and cash equivalents $ 138,589 $131,322 6% $ 141,078 $109,014 29%
Federal funds sold and securities borrowed or purchased under agreements
to resell 191,823 190,328 1222,483 224,331 (1)
Trading account assets 191,785 200,993 (5) 202,416 217,865 (7)
Debt securities 380,461 323,945 17 351,702 337,953 4
Loans and leases 881,391 928,233 (5) 903,901 918,641 (2)
Allowance for loan and lease losses (14,419) (17,428) (17) (15,973) (21,188) (25)
All other assets 334,904 344,880 (3) 339,983 376,897 (10)
Total assets $2,104,534 $2,102,273 — $2,145,590 $2,163,513 (1)
Liabilities
Deposits $1,118,936 $1,119,271 — $1,124,207 $1,089,735 3
Federal funds purchased and securities loaned or sold under agreements
to repurchase 201,277 198,106 2215,792 257,600 (16)
Trading account liabilities 74,192 83,469 (11) 87,151 88,323 (1)
Short-term borrowings 31,172 45,999 (32) 41,886 43,816 (4)
Long-term debt 243,139 249,674 (3) 253,607 263,417 (4)
All other liabilities 192,347 173,069 11 184,471 186,675 (1)
Total liabilities 1,861,063 1,869,588 — 1,907,114 1,929,566 (1)
Shareholders’ equity 243,471 232,685 5238,476 233,947 2
Total liabilities and shareholders’ equity $2,104,534 $2,102,273 — $2,145,590 $2,163,513 (1)
Year-end balance sheet amounts may vary from average
balance sheet amounts due to liquidity and balance sheet
management activities, primarily involving our portfolios of highly
liquid assets. These portfolios are designed to ensure the
adequacy of capital while enhancing our ability to manage liquidity
requirements for the Corporation and our customers, and to
position the balance sheet in accordance with the Corporation’s
risk appetite. The execution of these activities requires the use of
balance sheet and capital-related limits including spot, average
and risk-weighted asset limits, particularly within the market-
making activities of our trading businesses. One of our key
regulatory metrics, Tier 1 leverage ratio, is calculated based on
adjusted quarterly average total assets.
Balance Sheet Management Actions in 2014
The Corporation took certain actions during 2014 to further
optimize its balance sheet. While the overall size of the balance
sheet remained relatively unchanged compared to December 31,
2013, the composition has improved in terms of liquidity in
response to the new Basel 3 Liquidity Coverage Ratio (LCR)
requirements. We shifted the mix of certain discretionary assets
out of less liquid loans to more liquid debt securities. This included
the sale of $10.7 billion of residential mortgage loans with standby
insurance agreements and purchase of agency securities, and the
sale of $6.7 billion of nonperforming and other delinquent loans.
Though the Global Markets balance sheet was relatively stable,
there was a decrease of $11.8 billion in low-margin prime
brokerage loans. Ending deposits remained relatively unchanged
as we took actions to optimize the LCR liquidity value of deposits
while growing retail deposits. Additionally, from a capital
standpoint, $6.0 billion of preferred stock was issued during the
year and amendments to our outstanding Series T preferred stock
also improved Basel 3 Tier 1 regulatory capital.
Assets
Year-end total assets remained relatively unchanged from
December 31, 2013, though the asset mix changed in connection
with preparing for the new Basel 3 LCR requirements as discussed
above. The key drivers were increased debt securities due to
purchases of U.S. Treasury securities, and higher cash and cash
equivalents from higher interest-bearing deposits with the Federal
Reserve and non-U.S. central banks. These increases were largely
offset by a decline in consumer loan balances due to paydowns,
sales of residential loans with long-term standby agreements,
nonperforming and delinquent loan sales and net charge-offs
collectively outpacing new originations, and declines in all other
assets and in trading account assets.
Cash and Cash Equivalents
Year-end and average cash and cash equivalents increased $7.3
billion from December 31, 2013 and $32.1 billion in 2014 driven
by an increase in interest-bearing deposits with the Federal
Reserve and non-U.S. central banks in connection with preparing
for the Basel 3 LCR requirements. For more information, see
Liquidity Risk – Basel 3 Liquidity Standards on page 64.