Bank of America 2014 Annual Report Download - page 27
Download and view the complete annual report
Please find page 27 of the 2014 Bank of America annual report below. You can navigate through the pages in the report by either clicking on the pages listed below, or by using the keyword search tool below to find specific information within the annual report.-
 1
1 -
2
-
3
-
4
-
5
-
6
-
7
-
8
-
9
-
10
-
11
-
12
-
13
-
14
-
15
-
16
-
 17
17 -
 18
18 -
 19
19 -
 20
20 -
 21
21 -
 22
22 -
 23
23 -
 24
24 -
 25
25 -
 26
26 -
 27
27 -
 28
28 -
 29
29 -
 30
30 -
 31
31 -
 32
32 -
 33
33 -
 34
34 -
 35
35 -
 36
36 -
 37
37 -
38
-
39
-
40
-
41
-
42
-
43
-
44
-
45
-
46
-
47
-
48
-
49
-
50
-
51
-
52
-
53
-
54
-
55
-
56
-
57
-
58
-
59
-
60
-
61
-
62
-
63
-
64
-
65
-
66
-
67
-
68
-
69
-
70
-
71
-
72
-
73
-
74
-
75
-
76
-
77
-
78
-
79
-
80
-
81
-
82
-
83
-
84
-
85
-
86
-
87
-
88
-
89
-
90
-
91
-
92
-
93
-
94
-
95
-
96
-
97
-
98
-
99
-
100
-
101
-
102
-
103
-
104
-
105
-
106
-
107
-
108
-
109
-
110
-
111
-
112
-
113
-
114
-
115
-
116
-
117
-
118
-
119
-
120
-
121
-
122
-
123
-
124
-
125
-
126
-
127
-
128
-
129
-
130
-
131
-
132
-
133
-
134
-
135
-
136
-
137
-
138
-
139
-
140
-
141
-
142
-
143
-
144
-
145
-
146
-
147
-
148
-
149
-
150
-
151
-
152
-
153
-
154
-
155
-
156
-
157
-
158
-
159
-
160
-
161
-
162
-
163
-
164
-
165
-
166
-
167
-
168
-
169
-
170
-
171
-
172
-
173
-
174
-
175
-
176
-
177
-
178
-
179
-
180
-
181
-
182
-
183
-
184
-
185
-
186
-
187
-
188
-
189
-
190
-
191
-
192
-
193
-
194
-
195
-
196
-
197
-
198
-
199
-
200
-
201
-
202
-
203
-
204
-
205
-
206
-
207
-
208
-
209
-
210
-
211
-
212
-
213
-
214
-
215
-
216
-
217
-
218
-
219
-
220
-
221
-
222
-
223
-
224
-
225
-
226
-
227
-
228
-
229
-
230
-
231
-
232
-
233
-
234
-
235
-
236
-
237
-
238
-
239
-
240
-
241
-
242
-
243
-
244
-
245
-
246
-
247
-
248
-
249
-
250
-
251
-
252
-
253
-
254
-
255
-
256
-
257
-
258
-
259
-
260
-
261
-
262
-
263
-
264
-
265
-
266
-
267
-
268
-
269
-
270
-
271
-
272
 |
 |
Bank of America 2014 25
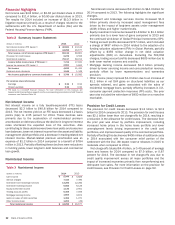
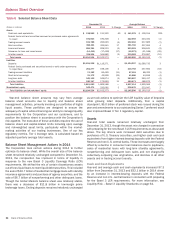
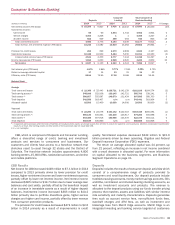
Federal Funds Sold and Securities Borrowed or
Purchased Under Agreements to Resell
Federal funds transactions involve lending reserve balances on a
short-term basis. Securities borrowed or purchased under
agreements to resell are collateralized lending transactions
utilized to accommodate customer transactions, earn interest rate
spreads, and obtain securities for settlement and for collateral.
Year-end federal funds sold and securities borrowed or purchased
under agreements to resell increased $1.5 billion from
December 31, 2013 driven by matched-book activity, partially
offset by roll-off of supranational positions and a mix shift into
securities. Average federal funds sold and securities borrowed or
purchased under agreements to resell decreased $1.8 billion in
2014 compared to 2013 due to lower matched-book activity.
Trading Account Assets
Trading account assets consist primarily of long positions in equity
and fixed-income securities including U.S. government and agency
securities, corporate securities and non-U.S. sovereign debt. Year-
end trading account assets decreased $9.2 billion primarily due
to lower equity securities inventory as a result of a decrease in
client hedging activity. Average trading account assets decreased
$15.4 billion primarily due to a reduction in U.S. Treasury securities
inventory.
Debt Securities
Debt securities primarily include U.S. Treasury and agency
securities, MBS, principally agency MBS, foreign bonds, corporate
bonds and municipal debt. We use the debt securities portfolio
primarily to manage interest rate and liquidity risk and to take
advantage of market conditions that create economically attractive
returns on these investments. Year-end and average debt
securities increased $56.5 billion and $13.7 billion primarily due
to net purchases of U.S. Treasury securities driven by the new LCR
rules, and increases in the fair value of available-for-sale (AFS)
debt securities resulting from the impact of lower interest rates.
For more information on debt securities, see Note 3 – Securities
to the Consolidated Financial Statements.
Loans and Leases
Year-end and average loans and leases decreased $46.8 billion
and $14.7 billion. The decreases were primarily driven by a decline
in consumer loan balances due to paydowns, loan sales and net
charge-offs outpacing new originations, and a decline in
commercial loan balances. For more information on the loan
portfolio, see Credit Risk Management on page 67.
Allowance for Loan and Lease Losses
Year-end and average allowance for loan and lease losses
decreased $3.0 billion and $5.2 billion primarily due to the impact
of improvements in credit quality from the improving economy. For
more information, see Allowance for Credit Losses on page 92.
All Other Assets
Year-end all other assets decreased $10.0 billion driven by other
earning assets and time deposits placed, partially offset by an
increase in derivative assets. Average all other assets decreased
$36.9 billion primarily driven by lower customer and other
receivables, time deposits placed, loans held-for-sale (LHFS) and
derivative assets.
Liabilities
At December 31, 2014, total liabilities were approximately $1.9
trillion, down $8.5 billion from December 31, 2013, driven by
planned reductions in short-term borrowings and long-term debt
as well as a decrease in trading account liabilities, partially offset
by increases in all other liabilities.
Deposits
Year-end deposits remained relatively unchanged from
December 31, 2013 due to declines in Global Banking offset by
an increase in retail deposits. Average deposits increased $34.5
billion primarily driven by customer and client shifts into more liquid
products in the low rate environment.
Federal Funds Purchased and Securities Loaned or Sold
Under Agreements to Repurchase
Federal funds transactions involve borrowing reserve balances on
a short-term basis. Securities loaned or sold under agreements
to repurchase are collateralized borrowing transactions utilized to
accommodate customer transactions, earn interest rate spreads
and finance assets on the balance sheet. Year-end federal funds
purchased and securities loaned or sold under agreements to
repurchase increased $3.2 billion primarily driven by matched-
book activity. Average federal funds purchased and securities
loaned or sold under agreements to repurchase decreased $41.8
billion primarily due to targeted reductions in the balance sheet.
Trading Account Liabilities
Trading account liabilities consist primarily of short positions in
equity and fixed-income securities including U.S. Treasury and
agency securities, corporate securities, and non-U.S. sovereign
debt. Year-end and average trading account liabilities decreased
$9.3 billion and $1.2 billion primarily due to lower levels of short
U.S. Treasury positions.
Short-term Borrowings
Short-term borrowings provide an additional funding source and
primarily consist of Federal Home Loan Bank (FHLB) short-term
borrowings, notes payable and various other borrowings that
generally have maturities of one year or less. Year-end and average
short-term borrowings decreased $14.8 billion and $1.9 billion
due to planned reductions in FHLB borrowings. For more
information on short-term borrowings, see Note 10 – Federal Funds
Sold or Purchased, Securities Financing Agreements and Short-term
Borrowings to the Consolidated Financial Statements.
Long-term Debt
Year-end and average long-term debt decreased $6.5 billion and
$9.8 billion. The decreases were a result of maturities outpacing
new issuances. For more information on long-term debt, see Note
11 – Long-term Debt to the Consolidated Financial Statements.
All Other Liabilities
Year-end all other liabilities increased $19.3 billion driven by
increases in derivative liabilities and payables. Average all other
liabilities decreased $2.2 billion driven by decreases in payables
and derivative liabilities.