Bank of America 2014 Annual Report Download - page 29
Download and view the complete annual report
Please find page 29 of the 2014 Bank of America annual report below. You can navigate through the pages in the report by either clicking on the pages listed below, or by using the keyword search tool below to find specific information within the annual report.-
 1
1 -
2
-
3
-
4
-
5
-
6
-
7
-
8
-
9
-
10
-
11
-
12
-
13
-
14
-
15
-
16
-
17
-
18
-
 19
19 -
 20
20 -
 21
21 -
 22
22 -
 23
23 -
 24
24 -
 25
25 -
 26
26 -
 27
27 -
 28
28 -
 29
29 -
 30
30 -
 31
31 -
 32
32 -
 33
33 -
 34
34 -
 35
35 -
 36
36 -
 37
37 -
 38
38 -
 39
39 -
40
-
41
-
42
-
43
-
44
-
45
-
46
-
47
-
48
-
49
-
50
-
51
-
52
-
53
-
54
-
55
-
56
-
57
-
58
-
59
-
60
-
61
-
62
-
63
-
64
-
65
-
66
-
67
-
68
-
69
-
70
-
71
-
72
-
73
-
74
-
75
-
76
-
77
-
78
-
79
-
80
-
81
-
82
-
83
-
84
-
85
-
86
-
87
-
88
-
89
-
90
-
91
-
92
-
93
-
94
-
95
-
96
-
97
-
98
-
99
-
100
-
101
-
102
-
103
-
104
-
105
-
106
-
107
-
108
-
109
-
110
-
111
-
112
-
113
-
114
-
115
-
116
-
117
-
118
-
119
-
120
-
121
-
122
-
123
-
124
-
125
-
126
-
127
-
128
-
129
-
130
-
131
-
132
-
133
-
134
-
135
-
136
-
137
-
138
-
139
-
140
-
141
-
142
-
143
-
144
-
145
-
146
-
147
-
148
-
149
-
150
-
151
-
152
-
153
-
154
-
155
-
156
-
157
-
158
-
159
-
160
-
161
-
162
-
163
-
164
-
165
-
166
-
167
-
168
-
169
-
170
-
171
-
172
-
173
-
174
-
175
-
176
-
177
-
178
-
179
-
180
-
181
-
182
-
183
-
184
-
185
-
186
-
187
-
188
-
189
-
190
-
191
-
192
-
193
-
194
-
195
-
196
-
197
-
198
-
199
-
200
-
201
-
202
-
203
-
204
-
205
-
206
-
207
-
208
-
209
-
210
-
211
-
212
-
213
-
214
-
215
-
216
-
217
-
218
-
219
-
220
-
221
-
222
-
223
-
224
-
225
-
226
-
227
-
228
-
229
-
230
-
231
-
232
-
233
-
234
-
235
-
236
-
237
-
238
-
239
-
240
-
241
-
242
-
243
-
244
-
245
-
246
-
247
-
248
-
249
-
250
-
251
-
252
-
253
-
254
-
255
-
256
-
257
-
258
-
259
-
260
-
261
-
262
-
263
-
264
-
265
-
266
-
267
-
268
-
269
-
270
-
271
-
272
 |
 |

Bank of America 2014 27
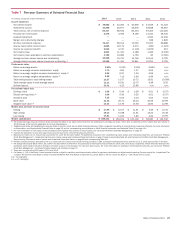
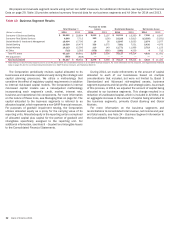
Table 7 Five-year Summary of Selected Financial Data
(In millions, except per share information) 2014 2013 2012 2011 2010
Income statement
Net interest income $ 39,952 $ 42,265 $ 40,656 $ 44,616 $ 51,523
Noninterest income 44,295 46,677 42,678 48,838 58,697
Total revenue, net of interest expense 84,247 88,942 83,334 93,454 110,220
Provision for credit losses 2,275 3,556 8,169 13,410 28,435
Goodwill impairment —— — 3,184 12,400
Merger and restructuring charges —— — 638 1,820
All other noninterest expense 75,117 69,214 72,093 76,452 68,888
Income (loss) before income taxes 6,855 16,172 3,072 (230) (1,323)
Income tax expense (benefit) 2,022 4,741 (1,116) (1,676) 915
Net income (loss) 4,833 11,431 4,188 1,446 (2,238)
Net income (loss) applicable to common shareholders 3,789 10,082 2,760 85 (3,595)
Average common shares issued and outstanding 10,528 10,731 10,746 10,143 9,790
Average diluted common shares issued and outstanding (1) 10,585 11,491 10,841 10,255 9,790
Performance ratios
Return on average assets 0.23%0.53% 0.19% 0.06% n/m
Return on average common shareholders’ equity 1.70 4.62 1.27 0.04 n/m
Return on average tangible common shareholders’ equity (2) 2.52 6.97 1.94 0.06 n/m
Return on average tangible shareholders’ equity (2) 2.92 7.13 2.60 0.96 n/m
Total ending equity to total ending assets 11.57 11.07 10.72 10.81 10.08%
Total average equity to total average assets 11.11 10.81 10.75 9.98 9.56
Dividend payout 33.31 4.25 15.86 n/m n/m
Per common share data
Earnings (loss) $0.36 $ 0.94 $ 0.26 $ 0.01 $ (0.37)
Diluted earnings (loss) (1) 0.36 0.90 0.25 0.01 (0.37)
Dividends paid 0.12 0.04 0.04 0.04 0.04
Book value 21.32 20.71 20.24 20.09 20.99
Tangible book value (2) 14.43 13.79 13.36 12.95 12.98
Market price per share of common stock
Closing $ 17.89 $ 15.57 $ 11.61 $ 5.56 $ 13.34
High closing 18.13 15.88 11.61 15.25 19.48
Low closing 14.51 11.03 5.80 4.99 10.95
Market capitalization $ 188,141 $ 164,914 $ 125,136 $ 58,580 $ 134,536
(1) The diluted earnings (loss) per common share excluded the effect of any equity instruments that are antidilutive to earnings per share. There were no potential common shares that were dilutive in
2010 because of the net loss applicable to common shareholders.
(2) Tangible equity ratios and tangible book value per share of common stock are non-GAAP financial measures. Other companies may define or calculate these measures differently. For more information
on these ratios, see Supplemental Financial Data on page 29, and for corresponding reconciliations to GAAP financial measures, see Statistical Table XV on page 131.
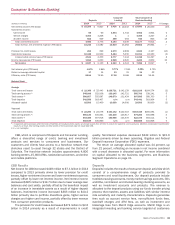
(3) For more information on the impact of the purchased credit-impaired loan portfolio on asset quality, see Consumer Portfolio Credit Risk Management on page 67.
(4) Includes the allowance for loan and lease losses and the reserve for unfunded lending commitments.
(5) Balances and ratios do not include loans accounted for under the fair value option. For additional exclusions from nonperforming loans, leases and foreclosed properties, see Consumer Portfolio
Credit Risk Management – Nonperforming Consumer Loans, Leases and Foreclosed Properties Activity on page 79 and corresponding Table 39, and Commercial Portfolio Credit Risk Management –
Nonperforming Commercial Loans, Leases and Foreclosed Properties Activity on page 86 and corresponding Table 48.
(6) Primarily includes amounts allocated to the U.S. credit card and unsecured consumer lending portfolios in CBB, purchased credit-impaired loans and the non-U.S. credit card portfolio in All Other.
(7) Net charge-offs exclude $810 million, $2.3 billion and $2.8 billion of write-offs in the purchased credit-impaired loan portfolio for 2014, 2013 and 2012, respectively. These write-offs decreased the
purchased credit-impaired valuation allowance included as part of the allowance for loan and lease losses. For more information on purchased credit-impaired write-offs, see Consumer Portfolio
Credit Risk Management – Purchased Credit-impaired Loan Portfolio on page 75.
(8) There were no write-offs of PCI loans in 2011 and 2010.
(9) On January 1, 2014, the Basel 3 rules became effective, subject to transition provisions primarily related to regulatory deductions and adjustments impacting Common equity tier 1 capital and Tier
1 capital. We reported under Basel 1 (which included the Market Risk Final Rules) at December 31, 2013. Basel 1 did not include the Basel 1 – 2013 Rules prior to 2013.
n/a = not applicable
n/m = not meaningful