Bank of America 2014 Annual Report Download - page 80
Download and view the complete annual report
Please find page 80 of the 2014 Bank of America annual report below. You can navigate through the pages in the report by either clicking on the pages listed below, or by using the keyword search tool below to find specific information within the annual report.-
 1
1 -
2
-
3
-
4
-
5
-
6
-
7
-
8
-
9
-
10
-
11
-
12
-
13
-
14
-
15
-
16
-
17
-
18
-
19
-
20
-
21
-
22
-
23
-
24
-
25
-
26
-
27
-
28
-
29
-
30
-
31
-
32
-
33
-
34
-
35
-
36
-
37
-
38
-
39
-
40
-
41
-
42
-
43
-
44
-
45
-
46
-
47
-
48
-
49
-
50
-
51
-
52
-
53
-
54
-
55
-
56
-
57
-
58
-
59
-
60
-
61
-
62
-
63
-
64
-
65
-
66
-
67
-
68
-
69
-
 70
70 -
 71
71 -
 72
72 -
 73
73 -
 74
74 -
 75
75 -
 76
76 -
 77
77 -
 78
78 -
 79
79 -
 80
80 -
 81
81 -
 82
82 -
 83
83 -
 84
84 -
 85
85 -
 86
86 -
 87
87 -
 88
88 -
 89
89 -
 90
90 -
91
-
92
-
93
-
94
-
95
-
96
-
97
-
98
-
99
-
100
-
101
-
102
-
103
-
104
-
105
-
106
-
107
-
108
-
109
-
110
-
111
-
112
-
113
-
114
-
115
-
116
-
117
-
118
-
119
-
120
-
121
-
122
-
123
-
124
-
125
-
126
-
127
-
128
-
129
-
130
-
131
-
132
-
133
-
134
-
135
-
136
-
137
-
138
-
139
-
140
-
141
-
142
-
143
-
144
-
145
-
146
-
147
-
148
-
149
-
150
-
151
-
152
-
153
-
154
-
155
-
156
-
157
-
158
-
159
-
160
-
161
-
162
-
163
-
164
-
165
-
166
-
167
-
168
-
169
-
170
-
171
-
172
-
173
-
174
-
175
-
176
-
177
-
178
-
179
-
180
-
181
-
182
-
183
-
184
-
185
-
186
-
187
-
188
-
189
-
190
-
191
-
192
-
193
-
194
-
195
-
196
-
197
-
198
-
199
-
200
-
201
-
202
-
203
-
204
-
205
-
206
-
207
-
208
-
209
-
210
-
211
-
212
-
213
-
214
-
215
-
216
-
217
-
218
-
219
-
220
-
221
-
222
-
223
-
224
-
225
-
226
-
227
-
228
-
229
-
230
-
231
-
232
-
233
-
234
-
235
-
236
-
237
-
238
-
239
-
240
-
241
-
242
-
243
-
244
-
245
-
246
-
247
-
248
-
249
-
250
-
251
-
252
-
253
-
254
-
255
-
256
-
257
-
258
-
259
-
260
-
261
-
262
-
263
-
264
-
265
-
266
-
267
-
268
-
269
-
270
-
271
-
272
 |
 |

78 Bank of America 2014
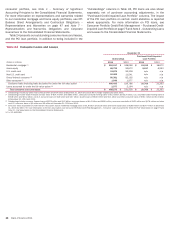
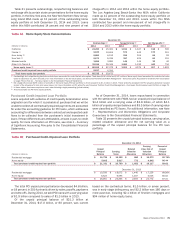
Non-U.S. Credit Card
Outstandings in the non-U.S. credit card portfolio, which are
recorded in All Other, decreased $1.1 billion in 2014 due to a
portfolio divestiture and weakening of the British Pound against
the U.S. Dollar. Net charge-offs decreased $157 million to $242
million in 2014 due to improvement in delinquencies as a result
of higher credit quality originations and an improved economic
environment, as well as improved recovery rates on previously
charged-off loans.
Unused lines of credit for non-U.S. credit card totaled $28.2
billion and $31.1 billion at December 31, 2014 and 2013. The
$2.9 billion decrease was driven by weakening of the British Pound
against the U.S. Dollar and a portfolio divestiture.
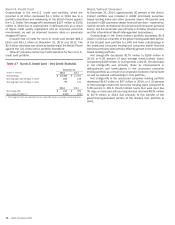
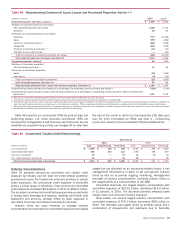
Table 37 presents certain key credit statistics for the non-U.S.
credit card portfolio.
Table 37 Non-U.S. Credit Card – Key Credit Statistics
December 31
(Dollars in millions) 2014 2013
Outstandings $ 10,465 $ 11,541
Accruing past due 30 days or more 183 248
Accruing past due 90 days or more 95 131
2014 2013
Net charge-offs $ 242 $ 399
Net charge-off ratios (1) 2.10% 3.68%
(1) Net charge-off ratios are calculated as net charge-offs divided by average outstanding loans.
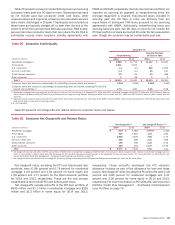
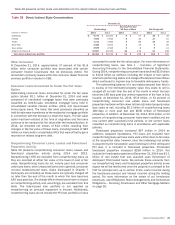
Direct/Indirect Consumer
At December 31, 2014, approximately 50 percent of the direct/
indirect portfolio was included in GWIM (principally securities-
based lending loans and other personal loans), 49 percent was
included in CBB (consumer dealer financial services – automotive,
marine, aircraft, recreational vehicle loans and consumer personal
loans), and the remainder was primarily in All Other (student loans
and the International Wealth Management businesses).
Outstandings in the direct/indirect portfolio decreased $1.8
billion in 2014 as a transfer of the government-guaranteed portion
of the student loan portfolio to LHFS and lower outstandings in
the unsecured consumer lending and consumer dealer financial
services portfolios were partially offset by growth in the securities-
based lending portfolio.
Net charge-offs decreased $176 million to $169 million in
2014, or 0.20 percent of total average direct/indirect loans,
compared to $345 million, or 0.42 percent, in 2013. This decrease
in net charge-offs was primarily driven by improvements in
delinquencies and bankruptcies in the unsecured consumer
lending portfolio as a result of an improved economic environment
as well as reduced outstandings in this portfolio.
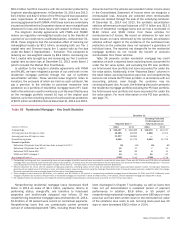
Net charge-offs in the unsecured consumer lending portfolio
decreased $143 million to $47 million in 2014, or 2.30 percent
of total average unsecured consumer lending loans compared to
5.26 percent in 2013. Direct/indirect loans that were past due
30 days or more and still accruing interest declined $634 million
to $379 million in 2014 due primarily to the transfer of the
government-guaranteed portion of the student loan portfolio to
LHFS.