Bank of America 2014 Annual Report Download - page 180
Download and view the complete annual report
Please find page 180 of the 2014 Bank of America annual report below. You can navigate through the pages in the report by either clicking on the pages listed below, or by using the keyword search tool below to find specific information within the annual report.-
 1
1 -
2
-
3
-
4
-
5
-
6
-
7
-
8
-
9
-
10
-
11
-
12
-
13
-
14
-
15
-
16
-
17
-
18
-
19
-
20
-
21
-
22
-
23
-
24
-
25
-
26
-
27
-
28
-
29
-
30
-
31
-
32
-
33
-
34
-
35
-
36
-
37
-
38
-
39
-
40
-
41
-
42
-
43
-
44
-
45
-
46
-
47
-
48
-
49
-
50
-
51
-
52
-
53
-
54
-
55
-
56
-
57
-
58
-
59
-
60
-
61
-
62
-
63
-
64
-
65
-
66
-
67
-
68
-
69
-
70
-
71
-
72
-
73
-
74
-
75
-
76
-
77
-
78
-
79
-
80
-
81
-
82
-
83
-
84
-
85
-
86
-
87
-
88
-
89
-
90
-
91
-
92
-
93
-
94
-
95
-
96
-
97
-
98
-
99
-
100
-
101
-
102
-
103
-
104
-
105
-
106
-
107
-
108
-
109
-
110
-
111
-
112
-
113
-
114
-
115
-
116
-
117
-
118
-
119
-
120
-
121
-
122
-
123
-
124
-
125
-
126
-
127
-
128
-
129
-
130
-
131
-
132
-
133
-
134
-
135
-
136
-
137
-
138
-
139
-
140
-
141
-
142
-
143
-
144
-
145
-
146
-
147
-
148
-
149
-
150
-
151
-
152
-
153
-
154
-
155
-
156
-
157
-
158
-
159
-
160
-
161
-
162
-
163
-
164
-
165
-
166
-
167
-
168
-
169
-
 170
170 -
 171
171 -
 172
172 -
 173
173 -
 174
174 -
 175
175 -
 176
176 -
 177
177 -
 178
178 -
 179
179 -
 180
180 -
 181
181 -
 182
182 -
 183
183 -
 184
184 -
 185
185 -
 186
186 -
 187
187 -
 188
188 -
 189
189 -
 190
190 -
191
-
192
-
193
-
194
-
195
-
196
-
197
-
198
-
199
-
200
-
201
-
202
-
203
-
204
-
205
-
206
-
207
-
208
-
209
-
210
-
211
-
212
-
213
-
214
-
215
-
216
-
217
-
218
-
219
-
220
-
221
-
222
-
223
-
224
-
225
-
226
-
227
-
228
-
229
-
230
-
231
-
232
-
233
-
234
-
235
-
236
-
237
-
238
-
239
-
240
-
241
-
242
-
243
-
244
-
245
-
246
-
247
-
248
-
249
-
250
-
251
-
252
-
253
-
254
-
255
-
256
-
257
-
258
-
259
-
260
-
261
-
262
-
263
-
264
-
265
-
266
-
267
-
268
-
269
-
270
-
271
-
272
 |
 |

178 Bank of America 2014
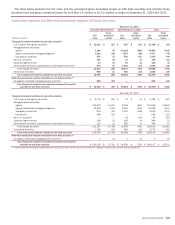
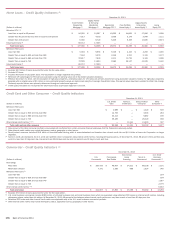
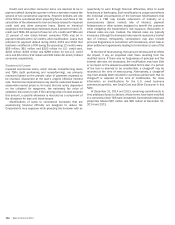
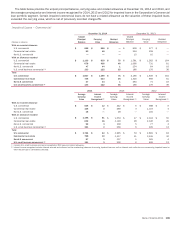
The table below provides the unpaid principal balance, carrying
value and related allowance at December 31, 2014 and 2013,
and the average carrying value and interest income recognized for
2014, 2013 and 2012 for impaired loans in the Corporation’s
Home Loans portfolio segment and includes primarily loans
managed by Legacy Assets & Servicing. Certain impaired home
loans do not have a related allowance as the current valuation of
these impaired loans exceeded the carrying value, which is net of
previously recorded charge-offs.
Impaired Loans – Home Loans
December 31, 2014 December 31, 2013
(Dollars in millions)
Unpaid
Principal
Balance
Carrying
Value
Related
Allowance
Unpaid
Principal
Balance
Carrying
Value
Related
Allowance
With no recorded allowance
Residential mortgage $ 19,710 $ 15,605 $ — $ 21,567 $ 16,450 $ —
Home equity 3,540 1,630 — 3,249 1,385 —
With an allowance recorded
Residential mortgage $ 7,861 $ 7,665 $ 531 $ 13,341 $ 12,862 $ 991
Home equity 852 728 196 893 761 240
Total
Residential mortgage $ 27,571 $ 23,270 $ 531 $ 34,908 $ 29,312 $ 991
Home equity 4,392 2,358 196 4,142 2,146 240
2014 2013 2012
Average
Carrying
Value
Interest
Income
Recognized (1)
Average
Carrying
Value
Interest
Income
Recognized (1)
Average
Carrying
Value
Interest
Income
Recognized (1)
With no recorded allowance
Residential mortgage $ 15,065 $ 490 $ 16,625 $ 621 $ 10,937 $ 366
Home equity 1,486 87 1,245 76 734 49
With an allowance recorded
Residential mortgage $ 10,826 $ 411 $ 13,926 $ 616 $ 11,575 $ 423
Home equity 743 25 912 41 1,145 44
Total
Residential mortgage $ 25,891 $ 901 $ 30,551 $ 1,237 $ 22,512 $ 789
Home equity 2,229 112 2,157 117 1,879 93
(1) Interest income recognized includes interest accrued and collected on the outstanding balances of accruing impaired loans as well as interest cash collections on nonaccruing impaired loans for
which the principal is considered collectible.
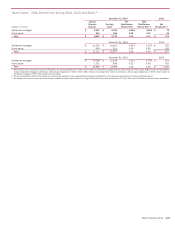
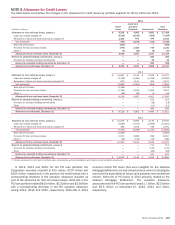
The following table presents the December 31, 2014, 2013
and 2012 unpaid principal balance, carrying value, and average
pre- and post-modification interest rates on home loans that were
modified in TDRs during 2014, 2013 and 2012, and net charge-
offs recorded during the period in which the modification occurred.
The following Home Loans portfolio segment tables include loans
that were initially classified as TDRs during the period and also
loans that had previously been classified as TDRs and were
modified again during the period. These TDRs are primarily
managed by Legacy Assets & Servicing.