Bank of America 2014 Annual Report Download - page 160
Download and view the complete annual report
Please find page 160 of the 2014 Bank of America annual report below. You can navigate through the pages in the report by either clicking on the pages listed below, or by using the keyword search tool below to find specific information within the annual report.-
 1
1 -
2
-
3
-
4
-
5
-
6
-
7
-
8
-
9
-
10
-
11
-
12
-
13
-
14
-
15
-
16
-
17
-
18
-
19
-
20
-
21
-
22
-
23
-
24
-
25
-
26
-
27
-
28
-
29
-
30
-
31
-
32
-
33
-
34
-
35
-
36
-
37
-
38
-
39
-
40
-
41
-
42
-
43
-
44
-
45
-
46
-
47
-
48
-
49
-
50
-
51
-
52
-
53
-
54
-
55
-
56
-
57
-
58
-
59
-
60
-
61
-
62
-
63
-
64
-
65
-
66
-
67
-
68
-
69
-
70
-
71
-
72
-
73
-
74
-
75
-
76
-
77
-
78
-
79
-
80
-
81
-
82
-
83
-
84
-
85
-
86
-
87
-
88
-
89
-
90
-
91
-
92
-
93
-
94
-
95
-
96
-
97
-
98
-
99
-
100
-
101
-
102
-
103
-
104
-
105
-
106
-
107
-
108
-
109
-
110
-
111
-
112
-
113
-
114
-
115
-
116
-
117
-
118
-
119
-
120
-
121
-
122
-
123
-
124
-
125
-
126
-
127
-
128
-
129
-
130
-
131
-
132
-
133
-
134
-
135
-
136
-
137
-
138
-
139
-
140
-
141
-
142
-
143
-
144
-
145
-
146
-
147
-
148
-
149
-
 150
150 -
 151
151 -
 152
152 -
 153
153 -
 154
154 -
 155
155 -
 156
156 -
 157
157 -
 158
158 -
 159
159 -
 160
160 -
 161
161 -
 162
162 -
 163
163 -
 164
164 -
 165
165 -
 166
166 -
 167
167 -
 168
168 -
 169
169 -
 170
170 -
171
-
172
-
173
-
174
-
175
-
176
-
177
-
178
-
179
-
180
-
181
-
182
-
183
-
184
-
185
-
186
-
187
-
188
-
189
-
190
-
191
-
192
-
193
-
194
-
195
-
196
-
197
-
198
-
199
-
200
-
201
-
202
-
203
-
204
-
205
-
206
-
207
-
208
-
209
-
210
-
211
-
212
-
213
-
214
-
215
-
216
-
217
-
218
-
219
-
220
-
221
-
222
-
223
-
224
-
225
-
226
-
227
-
228
-
229
-
230
-
231
-
232
-
233
-
234
-
235
-
236
-
237
-
238
-
239
-
240
-
241
-
242
-
243
-
244
-
245
-
246
-
247
-
248
-
249
-
250
-
251
-
252
-
253
-
254
-
255
-
256
-
257
-
258
-
259
-
260
-
261
-
262
-
263
-
264
-
265
-
266
-
267
-
268
-
269
-
270
-
271
-
272
 |
 |

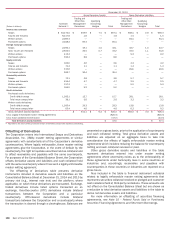
158 Bank of America 2014
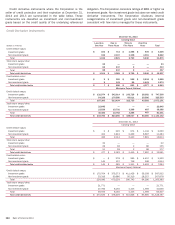
December 31, 2013
Gross Derivative Assets Gross Derivative Liabilities
(Dollars in billions)
Contract/
Notional (1)
Trading and
Other Risk
Management
Derivatives
Qualifying
Accounting
Hedges Total
Trading and
Other Risk
Management
Derivatives
Qualifying
Accounting
Hedges Total
Interest rate contracts
Swaps $ 33,272.0 $ 659.9 $ 7.5 $ 667.4 $ 658.4 $ 0.9 $ 659.3
Futures and forwards 8,217.6 1.6 — 1.6 1.5 — 1.5
Written options 2,065.4 — — — 64.4 — 64.4
Purchased options 2,028.3 65.4 — 65.4 — — —
Foreign exchange contracts
Swaps 2,284.1 43.1 1.0 44.1 42.7 1.0 43.7
Spot, futures and forwards 2,922.5 32.5 0.7 33.2 33.5 1.1 34.6
Written options 412.4 — — — 9.2 — 9.2
Purchased options 392.4 8.8 — 8.8 — — —
Equity contracts
Swaps 162.0 3.6 — 3.6 4.2 — 4.2
Futures and forwards 71.4 1.1 — 1.1 1.4 — 1.4
Written options 315.6 — — — 29.6 — 29.6
Purchased options 266.7 30.4 — 30.4 — — —
Commodity contracts
Swaps 73.1 3.8 — 3.8 5.7 — 5.7
Futures and forwards 454.4 4.7 — 4.7 2.5 — 2.5
Written options 157.3 — — — 5.0 — 5.0
Purchased options 164.0 5.2 — 5.2 — — —
Credit derivatives
Purchased credit derivatives:
Credit default swaps 1,305.1 15.7 — 15.7 28.1 — 28.1
Total return swaps/other 38.1 2.0 — 2.0 3.2 — 3.2
Written credit derivatives:
Credit default swaps 1,265.4 29.3 — 29.3 13.8 — 13.8
Total return swaps/other 63.4 4.0 — 4.0 0.2 — 0.2
Gross derivative assets/liabilities $ 911.1 $ 9.2 $ 920.3 $ 903.4 $ 3.0 $ 906.4
Less: Legally enforceable master netting agreements (825.5) (825.5)
Less: Cash collateral received/paid (47.3) (43.5)
Total derivative assets/liabilities $ 47.5 $ 37.4
(1) Represents the total contract/notional amount of derivative assets and liabilities outstanding.
Offsetting of Derivatives
The Corporation enters into International Swaps and Derivatives
Association, Inc. (ISDA) master netting agreements or similar
agreements with substantially all of the Corporation’s derivative
counterparties. Where legally enforceable, these master netting
agreements give the Corporation, in the event of default by the
counterparty, the right to liquidate securities held as collateral and
to offset receivables and payables with the same counterparty.
For purposes of the Consolidated Balance Sheet, the Corporation
offsets derivative assets and liabilities and cash collateral held
with the same counterparty where it has such a legally enforceable
master netting agreement.
The Offsetting of Derivatives table presents derivative
instruments included in derivative assets and liabilities on the
Consolidated Balance Sheet at December 31, 2014 and 2013 by
primary risk (e.g., interest rate risk) and the platform, where
applicable, on which these derivatives are transacted. Exchange-
traded derivatives include listed options transacted on an
exchange. Over-the-counter (OTC) derivatives include bilateral
transactions between the Corporation and a particular
counterparty. OTC-cleared derivatives include bilateral
transactions between the Corporation and a counterparty where
the transaction is cleared through a clearinghouse. Balances are
presented on a gross basis, prior to the application of counterparty
and cash collateral netting. Total gross derivative assets and
liabilities are adjusted on an aggregate basis to take into
consideration the effects of legally enforceable master netting
agreements which includes reducing the balance for counterparty
netting and cash collateral received or paid.
Other gross derivative assets and liabilities in the table
represent derivatives entered into under master netting
agreements where uncertainty exists as to the enforceability of
these agreements under bankruptcy laws in some countries or
industries and, accordingly, receivables and payables with
counterparties in these countries or industries are reported on a
gross basis.
Also included in the table is financial instrument collateral
related to legally enforceable master netting agreements that
represents securities collateral received or pledged and customer
cash collateral held at third-party custodians. These amounts are
not offset on the Consolidated Balance Sheet but are shown as
a reduction to total derivative assets and liabilities in the table to
derive net derivative assets and liabilities.
For more information on offsetting of securities financing
agreements, see Note 10 – Federal Funds Sold or Purchased,
Securities Financing Agreements and Short-term Borrowings.