Bank of America 2014 Annual Report Download - page 244
Download and view the complete annual report
Please find page 244 of the 2014 Bank of America annual report below. You can navigate through the pages in the report by either clicking on the pages listed below, or by using the keyword search tool below to find specific information within the annual report.-
 1
1 -
2
-
3
-
4
-
5
-
6
-
7
-
8
-
9
-
10
-
11
-
12
-
13
-
14
-
15
-
16
-
17
-
18
-
19
-
20
-
21
-
22
-
23
-
24
-
25
-
26
-
27
-
28
-
29
-
30
-
31
-
32
-
33
-
34
-
35
-
36
-
37
-
38
-
39
-
40
-
41
-
42
-
43
-
44
-
45
-
46
-
47
-
48
-
49
-
50
-
51
-
52
-
53
-
54
-
55
-
56
-
57
-
58
-
59
-
60
-
61
-
62
-
63
-
64
-
65
-
66
-
67
-
68
-
69
-
70
-
71
-
72
-
73
-
74
-
75
-
76
-
77
-
78
-
79
-
80
-
81
-
82
-
83
-
84
-
85
-
86
-
87
-
88
-
89
-
90
-
91
-
92
-
93
-
94
-
95
-
96
-
97
-
98
-
99
-
100
-
101
-
102
-
103
-
104
-
105
-
106
-
107
-
108
-
109
-
110
-
111
-
112
-
113
-
114
-
115
-
116
-
117
-
118
-
119
-
120
-
121
-
122
-
123
-
124
-
125
-
126
-
127
-
128
-
129
-
130
-
131
-
132
-
133
-
134
-
135
-
136
-
137
-
138
-
139
-
140
-
141
-
142
-
143
-
144
-
145
-
146
-
147
-
148
-
149
-
150
-
151
-
152
-
153
-
154
-
155
-
156
-
157
-
158
-
159
-
160
-
161
-
162
-
163
-
164
-
165
-
166
-
167
-
168
-
169
-
170
-
171
-
172
-
173
-
174
-
175
-
176
-
177
-
178
-
179
-
180
-
181
-
182
-
183
-
184
-
185
-
186
-
187
-
188
-
189
-
190
-
191
-
192
-
193
-
194
-
195
-
196
-
197
-
198
-
199
-
200
-
201
-
202
-
203
-
204
-
205
-
206
-
207
-
208
-
209
-
210
-
211
-
212
-
213
-
214
-
215
-
216
-
217
-
218
-
219
-
220
-
221
-
222
-
223
-
224
-
225
-
226
-
227
-
228
-
229
-
230
-
231
-
232
-
233
-
 234
234 -
 235
235 -
 236
236 -
 237
237 -
 238
238 -
 239
239 -
 240
240 -
 241
241 -
 242
242 -
 243
243 -
 244
244 -
 245
245 -
 246
246 -
 247
247 -
 248
248 -
 249
249 -
 250
250 -
 251
251 -
 252
252 -
 253
253 -
 254
254 -
255
-
256
-
257
-
258
-
259
-
260
-
261
-
262
-
263
-
264
-
265
-
266
-
267
-
268
-
269
-
270
-
271
-
272
 |
 |

242 Bank of America 2014
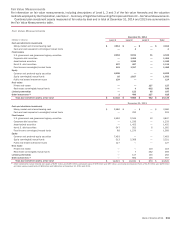
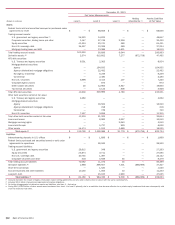
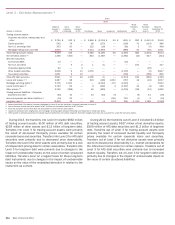
December 31, 2013
Fair Value Measurements
(Dollars in millions) Level 1 Level 2 Level 3
Netting
Adjustments (1)
Assets/Liabilities
at Fair Value
Assets
Federal funds sold and securities borrowed or purchased under
agreements to resell $ — $ 68,656 $ — $ — $ 68,656
Trading account assets:
U.S. government and agency securities (2) 34,222 14,625 — — 48,847
Corporate securities, trading loans and other 1,147 27,746 3,559 — 32,452
Equity securities 41,324 22,741 386 — 64,451
Non-U.S. sovereign debt 24,357 12,399 468 — 37,224
Mortgage trading loans and ABS — 13,388 4,631 — 18,019
Total trading account assets 101,050 90,899 9,044 — 200,993
Derivative assets (3) 2,374 910,602 7,277 (872,758) 47,495
AFS debt securities:
U.S. Treasury and agency securities 6,591 2,363 — — 8,954
Mortgage-backed securities:
Agency — 164,935 — — 164,935
Agency-collateralized mortgage obligations — 22,492 — — 22,492
Non-agency residential — 6,239 — — 6,239
Commercial — 2,480 — — 2,480
Non-U.S. securities 3,698 3,415 107 — 7,220
Corporate/Agency bonds — 873 — — 873
Other taxable securities 20 12,963 3,847 — 16,830
Tax-exempt securities — 5,122 806 — 5,928
Total AFS debt securities 10,309 220,882 4,760 — 235,951
Other debt securities carried at fair value:
U.S. Treasury and agency securities 4,062 — — — 4,062
Mortgage-backed securities:
Agency — 16,500 — — 16,500
Agency-collateralized mortgage obligations — 218 — — 218
Commercial — 749 — — 749
Non-U.S. securities 7,457 3,858 — — 11,315
Total other debt securities carried at fair value 11,519 21,325 — — 32,844
Loans and leases — 6,985 3,057 — 10,042
Mortgage servicing rights — — 5,042 — 5,042
Loans held-for-sale — 5,727 929 — 6,656
Other assets 14,474 1,912 1,669 — 18,055
Total assets (4) $139,726 $ 1,326,988 $ 31,778 $ (872,758) $ 625,734
Liabilities
Interest-bearing deposits in U.S. offices $ — $ 1,899 $ — $ — $ 1,899
Federal funds purchased and securities loaned or sold under
agreements to repurchase — 26,500 — — 26,500
Trading account liabilities:
U.S. government and agency securities 26,915 348 — — 27,263
Equity securities 23,874 3,711 — — 27,585
Non-U.S. sovereign debt 20,755 1,387 — — 22,142
Corporate securities and other 518 5,926 35 — 6,479
Total trading account liabilities 72,062 11,372 35 — 83,469
Derivative liabilities (3) 1,968 896,907 7,501 (868,969) 37,407
Short-term borrowings — 1,520 — — 1,520
Accrued expenses and other liabilities 10,130 1,093 10 — 11,233
Long-term debt — 45,045 1,990 — 47,035
Total liabilities (4) $ 84,160 $ 984,336 $ 9,536 $ (868,969) $ 209,063
(1) Amounts represent the impact of legally enforceable master netting agreements and also cash collateral held or placed with the same counterparties.
(2) Includes $15.6 billion of government-sponsored enterprise obligations.
(3) For further disaggregation of derivative assets and liabilities, see Note 2 – Derivatives.
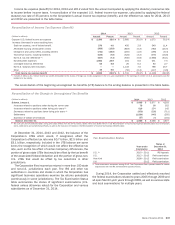
(4) During 2013, $500 million of other assets were transferred from Level 1 to Level 2 primarily due to a restriction that became effective for a private equity investment that was subsequently sold
once the restriction was lifted.