Bank of America 2014 Annual Report Download - page 117
Download and view the complete annual report
Please find page 117 of the 2014 Bank of America annual report below. You can navigate through the pages in the report by either clicking on the pages listed below, or by using the keyword search tool below to find specific information within the annual report.-
 1
1 -
2
-
3
-
4
-
5
-
6
-
7
-
8
-
9
-
10
-
11
-
12
-
13
-
14
-
15
-
16
-
17
-
18
-
19
-
20
-
21
-
22
-
23
-
24
-
25
-
26
-
27
-
28
-
29
-
30
-
31
-
32
-
33
-
34
-
35
-
36
-
37
-
38
-
39
-
40
-
41
-
42
-
43
-
44
-
45
-
46
-
47
-
48
-
49
-
50
-
51
-
52
-
53
-
54
-
55
-
56
-
57
-
58
-
59
-
60
-
61
-
62
-
63
-
64
-
65
-
66
-
67
-
68
-
69
-
70
-
71
-
72
-
73
-
74
-
75
-
76
-
77
-
78
-
79
-
80
-
81
-
82
-
83
-
84
-
85
-
86
-
87
-
88
-
89
-
90
-
91
-
92
-
93
-
94
-
95
-
96
-
97
-
98
-
99
-
100
-
101
-
102
-
103
-
104
-
105
-
106
-
 107
107 -
 108
108 -
 109
109 -
 110
110 -
 111
111 -
 112
112 -
 113
113 -
 114
114 -
 115
115 -
 116
116 -
 117
117 -
 118
118 -
 119
119 -
 120
120 -
 121
121 -
 122
122 -
 123
123 -
 124
124 -
 125
125 -
 126
126 -
 127
127 -
128
-
129
-
130
-
131
-
132
-
133
-
134
-
135
-
136
-
137
-
138
-
139
-
140
-
141
-
142
-
143
-
144
-
145
-
146
-
147
-
148
-
149
-
150
-
151
-
152
-
153
-
154
-
155
-
156
-
157
-
158
-
159
-
160
-
161
-
162
-
163
-
164
-
165
-
166
-
167
-
168
-
169
-
170
-
171
-
172
-
173
-
174
-
175
-
176
-
177
-
178
-
179
-
180
-
181
-
182
-
183
-
184
-
185
-
186
-
187
-
188
-
189
-
190
-
191
-
192
-
193
-
194
-
195
-
196
-
197
-
198
-
199
-
200
-
201
-
202
-
203
-
204
-
205
-
206
-
207
-
208
-
209
-
210
-
211
-
212
-
213
-
214
-
215
-
216
-
217
-
218
-
219
-
220
-
221
-
222
-
223
-
224
-
225
-
226
-
227
-
228
-
229
-
230
-
231
-
232
-
233
-
234
-
235
-
236
-
237
-
238
-
239
-
240
-
241
-
242
-
243
-
244
-
245
-
246
-
247
-
248
-
249
-
250
-
251
-
252
-
253
-
254
-
255
-
256
-
257
-
258
-
259
-
260
-
261
-
262
-
263
-
264
-
265
-
266
-
267
-
268
-
269
-
270
-
271
-
272
 |
 |

Bank of America 2014 115
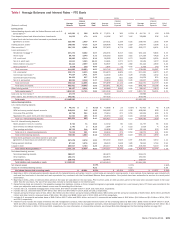
Table I Average Balances and Interest Rates – FTE Basis
2014 2013 2012
(Dollars in millions)
Average
Balance
Interest
Income/
Expense
Yield/
Rate
Average
Balance
Interest
Income/
Expense
Yield/
Rate
Average
Balance
Interest
Income/
Expense
Yield/
Rate
Earning assets
Interest-bearing deposits with the Federal Reserve and non-U.S.
central banks (1) $ 113,999 $ 308 0.27% $ 72,574 $ 182 0.25% $ 81,741 $190 0.23%
Time deposits placed and other short-term investments 11,032 170 1.54 16,066 187 1.16 22,888 236 1.03
Federal funds sold and securities borrowed or purchased under
agreements to resell 222,483 1,039 0.47 224,331 1,229 0.55 236,042 1,502 0.64
Trading account assets 145,686 4,716 3.24 168,998 4,879 2.89 170,647 5,306 3.11
Debt securities (2) 351,702 8,062 2.28 337,953 9,779 2.89 353,577 8,931 2.53
Loans and leases (3):
Residential mortgage (4) 237,270 8,462 3.57 256,535 9,317 3.63 264,164 9,845 3.73
Home equity 89,705 3,340 3.72 100,263 3,835 3.82 117,339 4,426 3.77
U.S. credit card 88,962 8,313 9.34 90,369 8,792 9.73 94,863 9,504 10.02
Non-U.S. credit card 11,511 1,200 10.42 10,861 1,271 11.70 13,549 1,572 11.60
Direct/Indirect consumer (5) 82,410 2,099 2.55 82,907 2,370 2.86 84,424 2,900 3.44
Other consumer (6) 2,028 139 6.86 1,807 72 4.02 2,359 140 5.95
Total consumer 511,886 23,553 4.60 542,742 25,657 4.73 576,698 28,387 4.92
U.S. commercial 230,175 6,630 2.88 218,874 6,809 3.11 201,352 6,979 3.47
Commercial real estate (7) 47,524 1,411 2.97 42,346 1,391 3.29 37,982 1,332 3.51
Commercial lease financing 24,423 837 3.43 23,863 851 3.56 21,879 874 4.00
Non-U.S. commercial 89,893 2,218 2.47 90,816 2,083 2.29 60,857 1,594 2.62
Total commercial 392,015 11,096 2.83 375,899 11,134 2.96 322,070 10,779 3.35
Total loans and leases 903,901 34,649 3.83 918,641 36,791 4.00 898,768 39,166 4.36
Other earning assets 66,127 2,811 4.25 80,985 2,832 3.50 88,047 2,970 3.36
Total earning assets (8) 1,814,930 51,755 2.85 1,819,548 55,879 3.07 1,851,710 58,301 3.15
Cash and due from banks (1) 27,079 36,440 33,998
Other assets, less allowance for loan and lease losses 303,581
307,525 305,648
Total assets $ 2,145,590 $ 2,163,513 $ 2,191,356
Interest-bearing liabilities
U.S. interest-bearing deposits:
Savings $ 46,270 $ 3 0.01% $ 43,868 $ 22 0.05% $ 41,453 $450.11%
NOW and money market deposit accounts 518,894 316 0.06 506,082 413 0.08 466,096 693 0.15
Consumer CDs and IRAs 66,798 264 0.40 79,914 471 0.59 95,559 693 0.73
Negotiable CDs, public funds and other deposits 31,502 106 0.33 26,553 116 0.43 20,928 128 0.61
Total U.S. interest-bearing deposits 663,464 689 0.10 656,417 1,022 0.16 624,036 1,559 0.25
Non-U.S. interest-bearing deposits:
Banks located in non-U.S. countries 8,744 74 0.84 12,432 80 0.64 14,737 94 0.64
Governments and official institutions 1,740 3 0.15 1,584 3 0.18 1,019 4 0.35
Time, savings and other 60,732 314 0.52 55,628 291 0.52 53,318 333 0.63
Total non-U.S. interest-bearing deposits 71,216 391 0.55 69,644 374 0.54 69,074 431 0.62
Total interest-bearing deposits 734,680 1,080 0.15 726,061 1,396 0.19 693,110 1,990 0.29
Federal funds purchased, securities loaned or sold under
agreements to repurchase and short-term borrowings 257,678 2,578 1.00 301,416 2,923 0.97 318,400 3,572 1.12
Trading account liabilities 87,151 1,576 1.81 88,323 1,638 1.85 78,554 1,763 2.24
Long-term debt 253,607 5,700 2.25 263,417 6,798 2.58 316,393 9,419 2.98
Total interest-bearing liabilities (8) 1,333,116 10,934 0.82 1,379,217 12,755 0.92 1,406,457 16,744 1.19
Noninterest-bearing sources:
Noninterest-bearing deposits 389,527
363,674 354,672
Other liabilities 184,471
186,675 194,550
Shareholders’ equity 238,476
233,947 235,677
Total liabilities and shareholders’ equity $ 2,145,590 $ 2,163,513 $ 2,191,356
Net interest spread 2.03% 2.15% 1.96%
Impact of noninterest-bearing sources 0.22 0.22 0.28
Net interest income/yield on earning assets $ 40,821 2.25% $ 43,124 2.37% $ 41,557 2.24%
(1) Beginning in 2014, interest-bearing deposits placed with the Federal Reserve and certain non-U.S. central banks are included in earning assets. In prior periods, these balances were included with
cash and due from banks in the cash and cash equivalents line, consistent with the Consolidated Balance Sheet presentation. Prior periods have been reclassified to conform to current period
presentation.
(2) Beginning in 2014, yields on debt securities carried at fair value are calculated on the cost basis. Prior to 2014, yields on debt securities carried at fair value were calculated based on fair value
rather than the cost basis. The use of fair value does not have a material impact on net interest yield.
(3) Nonperforming loans are included in the respective average loan balances. Income on these nonperforming loans is generally recognized on a cost recovery basis. PCI loans were recorded at fair
value upon acquisition and accrete interest income over the remaining life of the loan.
(4) Includes non-U.S. residential mortgage loans of $2 million, $79 million and $90 million in 2014, 2013 and 2012, respectively.
(5) Includes non-U.S. consumer loans of $4.4 billion, $6.7 billion and $7.8 billion in 2014, 2013 and 2012, respectively.
(6) Includes consumer finance loans of $1.1 billion, $1.3 billion and $1.5 billion; consumer leases of $818 million, $351 million and $0; consumer overdrafts of $148 million, $153 million and $128
million; and other non-U.S. consumer loans of $3 million, $5 million and $699 million; and in 2014, 2013 and 2012, respectively.
(7) Includes U.S. commercial real estate loans of $46.0 billion, $40.7 billion and $36.4 billion, and non-U.S. commercial real estate loans of $1.6 billion, $1.6 billion and $1.6 billion in 2014, 2013
and 2012, respectively.
(8) Interest income includes the impact of interest rate risk management contracts, which decreased interest income on the underlying assets by $58 million, $205 million and $754 million in 2014,
2013 and 2012, respectively. Interest expense includes the impact of interest rate risk management contracts, which decreased interest expense on the underlying liabilities by $2.5 billion, $2.4
billion and $2.3 billion in 2014, 2013 and 2012, respectively. For more information on interest rate contracts, see Interest Rate Risk Management for Non-trading Activities on page 102.