Bank of America 2014 Annual Report Download - page 264
Download and view the complete annual report
Please find page 264 of the 2014 Bank of America annual report below. You can navigate through the pages in the report by either clicking on the pages listed below, or by using the keyword search tool below to find specific information within the annual report.-
 1
1 -
2
-
3
-
4
-
5
-
6
-
7
-
8
-
9
-
10
-
11
-
12
-
13
-
14
-
15
-
16
-
17
-
18
-
19
-
20
-
21
-
22
-
23
-
24
-
25
-
26
-
27
-
28
-
29
-
30
-
31
-
32
-
33
-
34
-
35
-
36
-
37
-
38
-
39
-
40
-
41
-
42
-
43
-
44
-
45
-
46
-
47
-
48
-
49
-
50
-
51
-
52
-
53
-
54
-
55
-
56
-
57
-
58
-
59
-
60
-
61
-
62
-
63
-
64
-
65
-
66
-
67
-
68
-
69
-
70
-
71
-
72
-
73
-
74
-
75
-
76
-
77
-
78
-
79
-
80
-
81
-
82
-
83
-
84
-
85
-
86
-
87
-
88
-
89
-
90
-
91
-
92
-
93
-
94
-
95
-
96
-
97
-
98
-
99
-
100
-
101
-
102
-
103
-
104
-
105
-
106
-
107
-
108
-
109
-
110
-
111
-
112
-
113
-
114
-
115
-
116
-
117
-
118
-
119
-
120
-
121
-
122
-
123
-
124
-
125
-
126
-
127
-
128
-
129
-
130
-
131
-
132
-
133
-
134
-
135
-
136
-
137
-
138
-
139
-
140
-
141
-
142
-
143
-
144
-
145
-
146
-
147
-
148
-
149
-
150
-
151
-
152
-
153
-
154
-
155
-
156
-
157
-
158
-
159
-
160
-
161
-
162
-
163
-
164
-
165
-
166
-
167
-
168
-
169
-
170
-
171
-
172
-
173
-
174
-
175
-
176
-
177
-
178
-
179
-
180
-
181
-
182
-
183
-
184
-
185
-
186
-
187
-
188
-
189
-
190
-
191
-
192
-
193
-
194
-
195
-
196
-
197
-
198
-
199
-
200
-
201
-
202
-
203
-
204
-
205
-
206
-
207
-
208
-
209
-
210
-
211
-
212
-
213
-
214
-
215
-
216
-
217
-
218
-
219
-
220
-
221
-
222
-
223
-
224
-
225
-
226
-
227
-
228
-
229
-
230
-
231
-
232
-
233
-
234
-
235
-
236
-
237
-
238
-
239
-
240
-
241
-
242
-
243
-
244
-
245
-
246
-
247
-
248
-
249
-
250
-
251
-
252
-
253
-
 254
254 -
 255
255 -
 256
256 -
 257
257 -
 258
258 -
 259
259 -
 260
260 -
 261
261 -
 262
262 -
 263
263 -
 264
264 -
 265
265 -
 266
266 -
 267
267 -
 268
268 -
 269
269 -
 270
270 -
 271
271 -
 272
272
 |
 |

262 Bank of America 2014
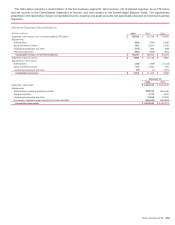
NOTE 25 Parent Company Information
The following tables present the Parent Company-only financial information. This financial information is presented in accordance with
bank regulatory reporting requirements and, accordingly, the information for 2012 has not been restated for the 2013 merger of Merrill
Lynch & Co., Inc. into Bank of America Corporation.
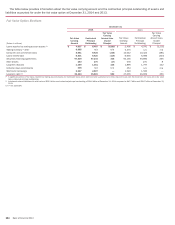
Condensed Statement of Income
(Dollars in millions) 2014 2013 2012
Income
Dividends from subsidiaries:
Bank holding companies and related subsidiaries $ 12,400 $ 8,532 $ 16,213
Nonbank companies and related subsidiaries 149 357 542
Interest from subsidiaries 1,836 2,087 627
Other income (loss) 72 233 (304)
Total income 14,457 11,209 17,078
Expense
Interest on borrowed funds 7,213 8,109 6,147
Noninterest expense 4,471 10,938 10,872
Total expense 11,684 19,047 17,019
Income (loss) before income taxes and equity in undistributed earnings of subsidiaries 2,773 (7,838) 59
Income tax benefit (4,079)(7,227) (5,883)
Income (loss) before equity in undistributed earnings of subsidiaries 6,852 (611) 5,942
Equity in undistributed earnings (losses) of subsidiaries:
Bank holding companies and related subsidiaries 3,613 14,150 1,072
Nonbank companies and related subsidiaries (5,632)(2,108) (2,826)
Total equity in undistributed earnings (losses) of subsidiaries (2,019)12,042 (1,754)
Net income $ 4,833 $ 11,431 $ 4,188
Net income applicable to common shareholders $ 3,789 $ 10,082 $ 2,760
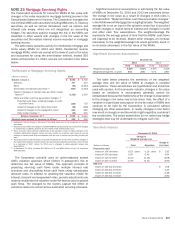
Condensed Balance Sheet
December 31
(Dollars in millions) 2014 2013
Assets
Cash held at bank subsidiaries (1) $ 100,304 $ 98,679
Securities 932 747
Receivables from subsidiaries:
Bank holding companies and related subsidiaries 23,356 23,558
Banks and related subsidiaries 2,395 1,682
Nonbank companies and related subsidiaries 52,251 46,577
Investments in subsidiaries:
Bank holding companies and related subsidiaries 270,441 268,234
Nonbank companies and related subsidiaries 2,139 1,818
Other assets 14,599 19,073
Total assets $ 466,417 $ 460,368
Liabilities and shareholders’ equity
Short-term borrowings $46 $ 181
Accrued expenses and other liabilities 16,872 15,428
Payables to subsidiaries:
Banks and related subsidiaries 2,559 1,991
Nonbank companies and related subsidiaries 17,698 15,980
Long-term debt 185,771 194,103
Total liabilities 222,946 227,683
Shareholders’ equity 243,471 232,685
Total liabilities and shareholders’ equity $ 466,417 $ 460,368
(1) Balance includes third-party cash held of $29 million and $33 million at December 31, 2014 and 2013.