Bank of America 2014 Annual Report Download - page 243
Download and view the complete annual report
Please find page 243 of the 2014 Bank of America annual report below. You can navigate through the pages in the report by either clicking on the pages listed below, or by using the keyword search tool below to find specific information within the annual report.-
 1
1 -
2
-
3
-
4
-
5
-
6
-
7
-
8
-
9
-
10
-
11
-
12
-
13
-
14
-
15
-
16
-
17
-
18
-
19
-
20
-
21
-
22
-
23
-
24
-
25
-
26
-
27
-
28
-
29
-
30
-
31
-
32
-
33
-
34
-
35
-
36
-
37
-
38
-
39
-
40
-
41
-
42
-
43
-
44
-
45
-
46
-
47
-
48
-
49
-
50
-
51
-
52
-
53
-
54
-
55
-
56
-
57
-
58
-
59
-
60
-
61
-
62
-
63
-
64
-
65
-
66
-
67
-
68
-
69
-
70
-
71
-
72
-
73
-
74
-
75
-
76
-
77
-
78
-
79
-
80
-
81
-
82
-
83
-
84
-
85
-
86
-
87
-
88
-
89
-
90
-
91
-
92
-
93
-
94
-
95
-
96
-
97
-
98
-
99
-
100
-
101
-
102
-
103
-
104
-
105
-
106
-
107
-
108
-
109
-
110
-
111
-
112
-
113
-
114
-
115
-
116
-
117
-
118
-
119
-
120
-
121
-
122
-
123
-
124
-
125
-
126
-
127
-
128
-
129
-
130
-
131
-
132
-
133
-
134
-
135
-
136
-
137
-
138
-
139
-
140
-
141
-
142
-
143
-
144
-
145
-
146
-
147
-
148
-
149
-
150
-
151
-
152
-
153
-
154
-
155
-
156
-
157
-
158
-
159
-
160
-
161
-
162
-
163
-
164
-
165
-
166
-
167
-
168
-
169
-
170
-
171
-
172
-
173
-
174
-
175
-
176
-
177
-
178
-
179
-
180
-
181
-
182
-
183
-
184
-
185
-
186
-
187
-
188
-
189
-
190
-
191
-
192
-
193
-
194
-
195
-
196
-
197
-
198
-
199
-
200
-
201
-
202
-
203
-
204
-
205
-
206
-
207
-
208
-
209
-
210
-
211
-
212
-
213
-
214
-
215
-
216
-
217
-
218
-
219
-
220
-
221
-
222
-
223
-
224
-
225
-
226
-
227
-
228
-
229
-
230
-
231
-
232
-
 233
233 -
 234
234 -
 235
235 -
 236
236 -
 237
237 -
 238
238 -
 239
239 -
 240
240 -
 241
241 -
 242
242 -
 243
243 -
 244
244 -
 245
245 -
 246
246 -
 247
247 -
 248
248 -
 249
249 -
 250
250 -
 251
251 -
 252
252 -
 253
253 -
254
-
255
-
256
-
257
-
258
-
259
-
260
-
261
-
262
-
263
-
264
-
265
-
266
-
267
-
268
-
269
-
270
-
271
-
272
 |
 |

Bank of America 2014 241
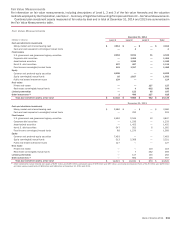
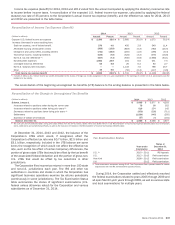
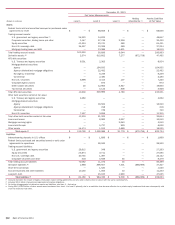
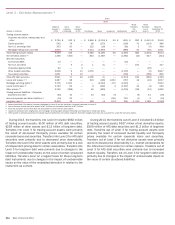
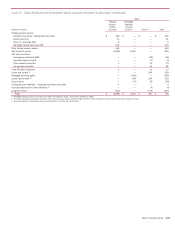
Recurring Fair Value
Assets and liabilities carried at fair value on a recurring basis at December 31, 2014 and 2013, including financial instruments which
the Corporation accounts for under the fair value option, are summarized in the following tables.
December 31, 2014
Fair Value Measurements
(Dollars in millions) Level 1 Level 2 Level 3
Netting
Adjustments (1)
Assets/Liabilities
at Fair Value
Assets
Federal funds sold and securities borrowed or purchased under
agreements to resell $ — $ 62,182 $ — $ —$ 62,182
Trading account assets:
U.S. government and agency securities (2) 33,470 17,549 — —51,019
Corporate securities, trading loans and other 243 31,699 3,270 —35,212
Equity securities 33,518 22,488 352 — 56,358
Non-U.S. sovereign debt 20,348 15,332 574 — 36,254
Mortgage trading loans and ABS — 10,879 2,063 —12,942
Total trading account assets 87,579 97,947 6,259 —191,785
Derivative assets (3) 4,957 972,977 6,851 (932,103) 52,682
AFS debt securities:
U.S. Treasury and agency securities 67,413 2,182 — —69,595
Mortgage-backed securities:
Agency — 165,039 — —165,039
Agency-collateralized mortgage obligations — 14,248 — —14,248
Non-agency residential — 4,175 279 — 4,454
Commercial — 4,000 — —4,000
Non-U.S. securities 3,191 3,029 10 —6,230
Corporate/Agency bonds —368 ——368
Other taxable securities 20 9,104 1,667 —10,791
Tax-exempt securities — 8,950 599 — 9,549
Total AFS debt securities 70,624 211,095 2,555 —284,274
Other debt securities carried at fair value:
U.S. Treasury and agency securities 1,541 — — —1,541
Mortgage-backed securities:
Agency — 15,704 — —15,704
Non-agency residential — 3,745 — —3,745
Non-U.S. securities 13,270 1,862 — —15,132
Other taxable securities —299 ——299
Total other debt securities carried at fair value 14,811 21,610 — —36,421
Loans and leases — 6,698 1,983 —8,681
Mortgage servicing rights — — 3,530 —3,530
Loans held-for-sale — 6,628 173 — 6,801
Other assets 11,581 1,381 911 — 13,873
Total assets (4) $ 189,552 $ 1,380,518 $ 22,262 $ (932,103) $ 660,229
Liabilities
Interest-bearing deposits in U.S. offices $ — $ 1,469 $ — $ —$ 1,469
Federal funds purchased and securities loaned or sold under
agreements to repurchase — 35,357 — —35,357
Trading account liabilities:
U.S. government and agency securities 18,514 446 ——18,960
Equity securities 24,679 3,670 — —28,349
Non-U.S. sovereign debt 16,089 3,625 — —19,714
Corporate securities and other 189 6,944 36 —7,169
Total trading account liabilities 59,471 14,685 36 —74,192
Derivative liabilities (3) 4,493 969,502 7,771 (934,857) 46,909
Short-term borrowings — 2,697 — —2,697
Accrued expenses and other liabilities 10,795 1,250 10 —12,055
Long-term debt — 34,042 2,362 —36,404
Total liabilities (4) $ 74,759 $ 1,059,002 $ 10,179 $ (934,857) $ 209,083
(1) Amounts represent the impact of legally enforceable master netting agreements and also cash collateral held or placed with the same counterparties.
(2) Includes $17.2 billion of government-sponsored enterprise obligations.
(3) For further disaggregation of derivative assets and liabilities, see Note 2 – Derivatives.
(4) During 2014, the Corporation reclassified certain assets and liabilities within its fair value hierarchy based on a review of its inputs used to measure fair value. Accordingly, approximately $4.1 billion
of assets related to U.S. government and agency securities, non-U.S. government securities and equity derivatives, and $570 million of liabilities related to equity derivatives were transferred from
Level 1 to Level 2.