Bank of America 2014 Annual Report Download - page 131
Download and view the complete annual report
Please find page 131 of the 2014 Bank of America annual report below. You can navigate through the pages in the report by either clicking on the pages listed below, or by using the keyword search tool below to find specific information within the annual report.-
 1
1 -
2
-
3
-
4
-
5
-
6
-
7
-
8
-
9
-
10
-
11
-
12
-
13
-
14
-
15
-
16
-
17
-
18
-
19
-
20
-
21
-
22
-
23
-
24
-
25
-
26
-
27
-
28
-
29
-
30
-
31
-
32
-
33
-
34
-
35
-
36
-
37
-
38
-
39
-
40
-
41
-
42
-
43
-
44
-
45
-
46
-
47
-
48
-
49
-
50
-
51
-
52
-
53
-
54
-
55
-
56
-
57
-
58
-
59
-
60
-
61
-
62
-
63
-
64
-
65
-
66
-
67
-
68
-
69
-
70
-
71
-
72
-
73
-
74
-
75
-
76
-
77
-
78
-
79
-
80
-
81
-
82
-
83
-
84
-
85
-
86
-
87
-
88
-
89
-
90
-
91
-
92
-
93
-
94
-
95
-
96
-
97
-
98
-
99
-
100
-
101
-
102
-
103
-
104
-
105
-
106
-
107
-
108
-
109
-
110
-
111
-
112
-
113
-
114
-
115
-
116
-
117
-
118
-
119
-
120
-
 121
121 -
 122
122 -
 123
123 -
 124
124 -
 125
125 -
 126
126 -
 127
127 -
 128
128 -
 129
129 -
 130
130 -
 131
131 -
 132
132 -
 133
133 -
 134
134 -
 135
135 -
 136
136 -
 137
137 -
 138
138 -
 139
139 -
 140
140 -
 141
141 -
142
-
143
-
144
-
145
-
146
-
147
-
148
-
149
-
150
-
151
-
152
-
153
-
154
-
155
-
156
-
157
-
158
-
159
-
160
-
161
-
162
-
163
-
164
-
165
-
166
-
167
-
168
-
169
-
170
-
171
-
172
-
173
-
174
-
175
-
176
-
177
-
178
-
179
-
180
-
181
-
182
-
183
-
184
-
185
-
186
-
187
-
188
-
189
-
190
-
191
-
192
-
193
-
194
-
195
-
196
-
197
-
198
-
199
-
200
-
201
-
202
-
203
-
204
-
205
-
206
-
207
-
208
-
209
-
210
-
211
-
212
-
213
-
214
-
215
-
216
-
217
-
218
-
219
-
220
-
221
-
222
-
223
-
224
-
225
-
226
-
227
-
228
-
229
-
230
-
231
-
232
-
233
-
234
-
235
-
236
-
237
-
238
-
239
-
240
-
241
-
242
-
243
-
244
-
245
-
246
-
247
-
248
-
249
-
250
-
251
-
252
-
253
-
254
-
255
-
256
-
257
-
258
-
259
-
260
-
261
-
262
-
263
-
264
-
265
-
266
-
267
-
268
-
269
-
270
-
271
-
272
 |
 |

Bank of America 2014 129
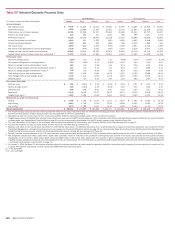
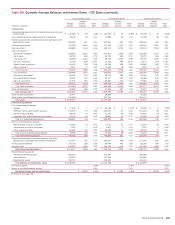
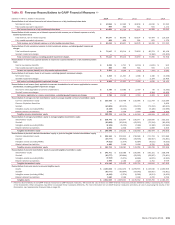
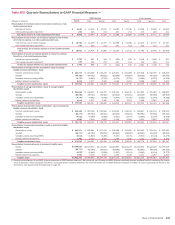
Table XIII Quarterly Average Balances and Interest Rates – FTE Basis (continued)
Second Quarter 2014 First Quarter 2014 Fourth Quarter 2013
(Dollars in millions)
Average
Balance
Interest
Income/
Expense
Yield/
Rate
Average
Balance
Interest
Income/
Expense
Yield/
Rate
Average
Balance
Interest
Income/
Expense
Yield/
Rate
Earning assets
Interest-bearing deposits with the Federal Reserve and non-U.S.
central banks (1) $ 123,582 $ 85 0.28% $ 112,570 $ 72 0.26% $ 90,196 $590.26%
Time deposits placed and other short-term investments 10,509 39 1.51 13,880 49 1.43 15,782 48 1.21
Federal funds sold and securities borrowed or purchased under
agreements to resell 235,393 297 0.51 212,504 265 0.51 203,415 304 0.59
Trading account assets 147,798 1,214 3.29 147,583 1,213 3.32 156,194 1,182 3.01
Debt securities (2) 345,889 2,134 2.46 329,711 2,005 2.41 325,119 2,454 3.02
Loans and leases (3):
Residential mortgage (4) 243,405 2,195 3.61 247,561 2,238 3.62 253,988 2,373 3.74
Home equity 90,729 842 3.72 92,754 853 3.71 95,374 954 3.98
U.S. credit card 88,058 2,042 9.30 89,545 2,092 9.48 90,057 2,125 9.36
Non-U.S. credit card 11,759 308 10.51 11,554 308 10.79 11,171 310 11.01
Direct/Indirect consumer (5) 82,102 524 2.56 81,728 530 2.63 82,990 565 2.70
Other consumer (6) 2,012 17 3.60 1,962 18 3.66 1,929 17 3.73
Total consumer 518,065 5,928 4.58 525,104 6,039 4.64 535,509 6,344 4.72
U.S. commercial 230,486 1,673 2.91 228,058 1,651 2.93 225,596 1,700 2.99
Commercial real estate (7) 48,315 357 2.97 48,753 368 3.06 46,341 373 3.20
Commercial lease financing 24,409 193 3.16 24,727 234 3.78 24,468 206 3.37
Non-U.S. commercial 91,305 569 2.50 92,840 543 2.37 97,863 544 2.21
Total commercial 394,515 2,792 2.84 394,378 2,796 2.87 394,268 2,823 2.84
Total loans and leases 912,580 8,720 3.83 919,482 8,835 3.88 929,777 9,167 3.92
Other earning assets 65,099 665 4.09 67,568 697 4.18 78,214 711 3.61
Total earning assets (8) 1,840,850 13,154 2.86 1,803,298 13,136 2.93 1,798,697 13,925 3.08
Cash and cash equivalents (1) 27,377 28,258 35,063
Other assets, less allowance for loan and lease losses 301,328 307,710 301,115
Total assets $ 2,169,555 $ 2,139,266 $ 2,134,875
Interest-bearing liabilities
U.S. interest-bearing deposits:
Savings $ 47,450 $ — —% $ 45,196 $ 1 0.01% $ 43,665 $ 5 0.05%
NOW and money market deposit accounts 519,399 79 0.06 523,237 83 0.06 514,220 89 0.07
Consumer CDs and IRAs 68,706 70 0.41 71,141 84 0.48 74,635 96 0.51
Negotiable CDs, public funds and other deposits 33,412 29 0.35 29,826 27 0.37 29,060 29 0.39
Total U.S. interest-bearing deposits 668,967 178 0.11 669,400 195 0.12 661,580 219 0.13
Non-U.S. interest-bearing deposits:
Banks located in non-U.S. countries 10,538 19 0.72 11,071 21 0.75 13,902 22 0.62
Governments and official institutions 1,754 — 0.14 1,857 1 0.14 1,734 1 0.18
Time, savings and other 64,091 85 0.53 60,506 74 0.50 58,529 72 0.49
Total non-U.S. interest-bearing deposits 76,383 104 0.55 73,434 96 0.53 74,165 95 0.51
Total interest-bearing deposits 745,350 282 0.15 742,834 291 0.16 735,745 314 0.17
Federal funds purchased, securities loaned or sold under
agreements to repurchase and short-term borrowings 271,247 763 1.13 252,971 609 0.98 271,538 682 1.00
Trading account liabilities 95,153 398 1.68 90,448 435 1.95 82,393 364 1.75
Long-term debt 259,825 1,485 2.29 253,678 1,515 2.41 251,055 1,566 2.48
Total interest-bearing liabilities (8) 1,371,575 2,928 0.86 1,339,931 2,850 0.86 1,340,731 2,926 0.87
Noninterest-bearing sources:
Noninterest-bearing deposits 383,213 375,344 376,929
Other liabilities 178,970 187,438 183,800
Shareholders’ equity 235,797 236,553 233,415
Total liabilities and shareholders’ equity $ 2,169,555 $ 2,139,266 $ 2,134,875
Net interest spread 2.00% 2.07% 2.21%
Impact of noninterest-bearing sources 0.22 0.22 0.23
Net interest income/yield on earning assets $ 10,226 2.22% $ 10,286 2.29% $ 10,999 2.44%
For footnotes see page 128.