Bank of America 2014 Annual Report Download - page 97
Download and view the complete annual report
Please find page 97 of the 2014 Bank of America annual report below. You can navigate through the pages in the report by either clicking on the pages listed below, or by using the keyword search tool below to find specific information within the annual report.-
 1
1 -
2
-
3
-
4
-
5
-
6
-
7
-
8
-
9
-
10
-
11
-
12
-
13
-
14
-
15
-
16
-
17
-
18
-
19
-
20
-
21
-
22
-
23
-
24
-
25
-
26
-
27
-
28
-
29
-
30
-
31
-
32
-
33
-
34
-
35
-
36
-
37
-
38
-
39
-
40
-
41
-
42
-
43
-
44
-
45
-
46
-
47
-
48
-
49
-
50
-
51
-
52
-
53
-
54
-
55
-
56
-
57
-
58
-
59
-
60
-
61
-
62
-
63
-
64
-
65
-
66
-
67
-
68
-
69
-
70
-
71
-
72
-
73
-
74
-
75
-
76
-
77
-
78
-
79
-
80
-
81
-
82
-
83
-
84
-
85
-
86
-
 87
87 -
 88
88 -
 89
89 -
 90
90 -
 91
91 -
 92
92 -
 93
93 -
 94
94 -
 95
95 -
 96
96 -
 97
97 -
 98
98 -
 99
99 -
 100
100 -
 101
101 -
 102
102 -
 103
103 -
 104
104 -
 105
105 -
 106
106 -
 107
107 -
108
-
109
-
110
-
111
-
112
-
113
-
114
-
115
-
116
-
117
-
118
-
119
-
120
-
121
-
122
-
123
-
124
-
125
-
126
-
127
-
128
-
129
-
130
-
131
-
132
-
133
-
134
-
135
-
136
-
137
-
138
-
139
-
140
-
141
-
142
-
143
-
144
-
145
-
146
-
147
-
148
-
149
-
150
-
151
-
152
-
153
-
154
-
155
-
156
-
157
-
158
-
159
-
160
-
161
-
162
-
163
-
164
-
165
-
166
-
167
-
168
-
169
-
170
-
171
-
172
-
173
-
174
-
175
-
176
-
177
-
178
-
179
-
180
-
181
-
182
-
183
-
184
-
185
-
186
-
187
-
188
-
189
-
190
-
191
-
192
-
193
-
194
-
195
-
196
-
197
-
198
-
199
-
200
-
201
-
202
-
203
-
204
-
205
-
206
-
207
-
208
-
209
-
210
-
211
-
212
-
213
-
214
-
215
-
216
-
217
-
218
-
219
-
220
-
221
-
222
-
223
-
224
-
225
-
226
-
227
-
228
-
229
-
230
-
231
-
232
-
233
-
234
-
235
-
236
-
237
-
238
-
239
-
240
-
241
-
242
-
243
-
244
-
245
-
246
-
247
-
248
-
249
-
250
-
251
-
252
-
253
-
254
-
255
-
256
-
257
-
258
-
259
-
260
-
261
-
262
-
263
-
264
-
265
-
266
-
267
-
268
-
269
-
270
-
271
-
272
 |
 |

Bank of America 2014 95
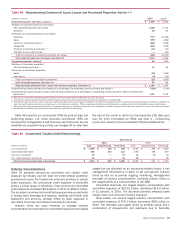
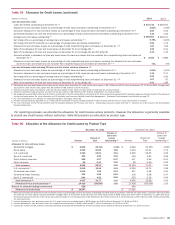
Table 59 Allowance for Credit Losses (continued)
(Dollars in millions) 2014 2013
Loan and allowance ratios:
Loans and leases outstanding at December 31 (4) $ 872,710 $ 918,191
Allowance for loan and lease losses as a percentage of total loans and leases outstanding at December 31 (4) 1.65%1.90%
Consumer allowance for loan and lease losses as a percentage of total consumer loans and leases outstanding at December 31 (5) 2.05 2.53
Commercial allowance for loan and lease losses as a percentage of total commercial loans and leases outstanding at December 31 (6) 1.15 1.03
Average loans and leases outstanding (4) $ 894,001 $ 909,127
Net charge-offs as a percentage of average loans and leases outstanding (4, 7) 0.49%0.87%
Net charge-offs and PCI write-offs as a percentage of average loans and leases outstanding (4) 0.58 1.13
Allowance for loan and lease losses as a percentage of total nonperforming loans and leases at December 31 (4, 8) 121 102
Ratio of the allowance for loan and lease losses at December 31 to net charge-offs (7) 3.29 2.21
Ratio of the allowance for loan and lease losses at December 31 to net charge-offs and PCI write-offs 2.78 1.70
Amounts included in allowance for loan and lease losses for loans and leases that are excluded from nonperforming loans and leases at
December 31 (9) $ 5,944 $7,680
Allowance for loan and lease losses as a percentage of total nonperforming loans and leases, excluding the allowance for loan and lease
losses for loans and leases that are excluded from nonperforming loans and leases at December 31 (4, 9) 71%57%
Loan and allowance ratios excluding PCI loans and the related valuation allowance: (10)
Allowance for loan and lease losses as a percentage of total loans and leases outstanding at December 31 (4) 1.50%1.67%
Consumer allowance for loan and lease losses as a percentage of total consumer loans and leases outstanding at December 31 (5) 1.79 2.17
Net charge-offs as a percentage of average loans and leases outstanding (4) 0.50 0.90
Allowance for loan and lease losses as a percentage of total nonperforming loans and leases at December 31 (4, 8) 107 87
Ratio of the allowance for loan and lease losses at December 31 to net charge-offs 2.91 1.89
(4) Outstanding loan and lease balances and ratios do not include loans accounted for under the fair value option of $8.7 billion and $10.0 billion at December 31, 2014 and 2013. Average loans
accounted for under the fair value option were $9.9 billion and $9.5 billion in 2014 and 2013.
(5) Excludes consumer loans accounted for under the fair value option of $2.1 billion and $2.2 billion at December 31, 2014 and 2013.
(6) Excludes commercial loans accounted for under the fair value option of $6.6 billion and $7.9 billion at December 31, 2014 and 2013.
(7) Net charge-offs exclude $810 million and $2.3 billion of write-offs in the PCI loan portfolio in 2014 and 2013. These write-offs decreased the PCI valuation allowance included as part of the allowance
for loan and lease losses. For more information on PCI write-offs, see Consumer Portfolio Credit Risk Management – Purchased Credit-impaired Loan Portfolio on page 75.
(8) For more information on our definition of nonperforming loans, see pages 79 and 86.
(9) Primarily includes amounts allocated to U.S. credit card and unsecured consumer lending portfolios in CBB, PCI loans and the non-U.S. credit card portfolio in All Other.
(10) For more information on the PCI loan portfolio and the valuation allowance for PCI loans, see Note 4 – Outstanding Loans and Leases and Note 5 – Allowance for Credit Losses to the Consolidated
Financial Statements.
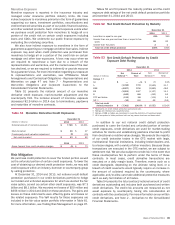
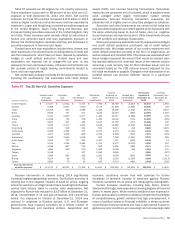
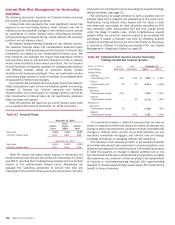
For reporting purposes, we allocate the allowance for credit losses across products. However, the allowance is generally available
to absorb any credit losses without restriction. Table 60 presents our allocation by product type.
Table 60 Allocation of the Allowance for Credit Losses by Product Type
December 31, 2014 December 31, 2013
(Dollars in millions) Amount
Percent of
Total
Percent of
Loans and
Leases
Outstanding (1) Amount
Percent of
Total
Percent of
Loans and
Leases
Outstanding (1)
Allowance for loan and lease losses
Residential mortgage $ 2,900 20.11% 1.34%$ 4,084 23.43% 1.65%
Home equity 3,035 21.05 3.54 4,434 25.44 4.73
U.S. credit card 3,320 23.03 3.61 3,930 22.55 4.26
Non-U.S. credit card 369 2.56 3.53 459 2.63 3.98
Direct/Indirect consumer 299 2.07 0.37 417 2.39 0.51
Other consumer 59 0.41 3.15 99 0.58 5.02
Total consumer 9,982 69.23 2.05 13,423 77.02 2.53
U.S. commercial (2) 2,619 18.16 1.12 2,394 13.74 1.06
Commercial real estate 1,016 7.05 2.13 917 5.26 1.91
Commercial lease financing 153 1.06 0.62 118 0.68 0.47
Non-U.S. commercial 649 4.50 0.81 576 3.30 0.64
Total commercial (3) 4,437 30.77 1.15 4,005 22.98 1.03
Allowance for loan and lease losses (4) 14,419 100.00% 1.65 17,428 100.00% 1.90
Reserve for unfunded lending commitments 528 484
Allowance for credit losses $ 14,947 $ 17,912
(1) Ratios are calculated as allowance for loan and lease losses as a percentage of loans and leases outstanding excluding loans accounted for under the fair value option. Consumer loans accounted
for under the fair value option included residential mortgage loans of $1.9 billion and $2.0 billion and home equity loans of $196 million and $147 million at December 31, 2014 and 2013.
Commercial loans accounted for under the fair value option included U.S. commercial loans of $1.9 billion and $1.5 billion and non-U.S. commercial loans of $4.7 billion and $6.4 billion at December
31, 2014 and 2013.
(2) Includes allowance for loan and lease losses for U.S. small business commercial loans of $536 million and $462 million at December 31, 2014 and 2013.
(3) Includes allowance for loan and lease losses for impaired commercial loans of $159 million and $277 million at December 31, 2014 and 2013.
(4) Includes $1.7 billion and $2.5 billion of valuation allowance presented with the allowance for loan and lease losses related to PCI loans at December 31, 2014 and 2013.