Bank of America 2014 Annual Report Download - page 101
Download and view the complete annual report
Please find page 101 of the 2014 Bank of America annual report below. You can navigate through the pages in the report by either clicking on the pages listed below, or by using the keyword search tool below to find specific information within the annual report.-
 1
1 -
2
-
3
-
4
-
5
-
6
-
7
-
8
-
9
-
10
-
11
-
12
-
13
-
14
-
15
-
16
-
17
-
18
-
19
-
20
-
21
-
22
-
23
-
24
-
25
-
26
-
27
-
28
-
29
-
30
-
31
-
32
-
33
-
34
-
35
-
36
-
37
-
38
-
39
-
40
-
41
-
42
-
43
-
44
-
45
-
46
-
47
-
48
-
49
-
50
-
51
-
52
-
53
-
54
-
55
-
56
-
57
-
58
-
59
-
60
-
61
-
62
-
63
-
64
-
65
-
66
-
67
-
68
-
69
-
70
-
71
-
72
-
73
-
74
-
75
-
76
-
77
-
78
-
79
-
80
-
81
-
82
-
83
-
84
-
85
-
86
-
87
-
88
-
89
-
90
-
 91
91 -
 92
92 -
 93
93 -
 94
94 -
 95
95 -
 96
96 -
 97
97 -
 98
98 -
 99
99 -
 100
100 -
 101
101 -
 102
102 -
 103
103 -
 104
104 -
 105
105 -
 106
106 -
 107
107 -
 108
108 -
 109
109 -
 110
110 -
 111
111 -
112
-
113
-
114
-
115
-
116
-
117
-
118
-
119
-
120
-
121
-
122
-
123
-
124
-
125
-
126
-
127
-
128
-
129
-
130
-
131
-
132
-
133
-
134
-
135
-
136
-
137
-
138
-
139
-
140
-
141
-
142
-
143
-
144
-
145
-
146
-
147
-
148
-
149
-
150
-
151
-
152
-
153
-
154
-
155
-
156
-
157
-
158
-
159
-
160
-
161
-
162
-
163
-
164
-
165
-
166
-
167
-
168
-
169
-
170
-
171
-
172
-
173
-
174
-
175
-
176
-
177
-
178
-
179
-
180
-
181
-
182
-
183
-
184
-
185
-
186
-
187
-
188
-
189
-
190
-
191
-
192
-
193
-
194
-
195
-
196
-
197
-
198
-
199
-
200
-
201
-
202
-
203
-
204
-
205
-
206
-
207
-
208
-
209
-
210
-
211
-
212
-
213
-
214
-
215
-
216
-
217
-
218
-
219
-
220
-
221
-
222
-
223
-
224
-
225
-
226
-
227
-
228
-
229
-
230
-
231
-
232
-
233
-
234
-
235
-
236
-
237
-
238
-
239
-
240
-
241
-
242
-
243
-
244
-
245
-
246
-
247
-
248
-
249
-
250
-
251
-
252
-
253
-
254
-
255
-
256
-
257
-
258
-
259
-
260
-
261
-
262
-
263
-
264
-
265
-
266
-
267
-
268
-
269
-
270
-
271
-
272
 |
 |
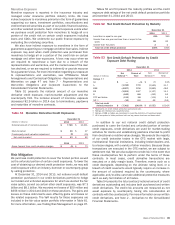
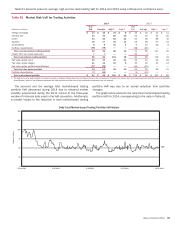
Bank of America 2014 99
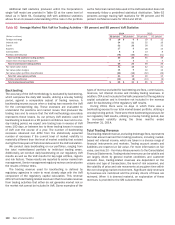
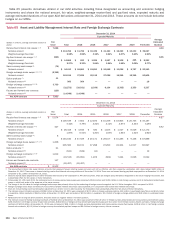
Table 61 presents year-end, average, high and low daily trading VaR for 2014 and 2013 using a 99 percent confidence level.
Table 61 Market Risk VaR for Trading Activities
2014 2013
(Dollars in millions)
Year
End Average High (1) Low (1)
Year
End Average High (1) Low (1)
Foreign exchange $13$16$24$ 8
$15$19$41$11
Interest rate 24 34 60 19 34 32 61 20
Credit 43 52 82 32 61 58 86 41
Equities 16 17 32 11 23 28 57 16
Commodities 8810661320 6
Portfolio diversification (56) (78) — — (68) (85) — —
Total covered positions trading portfolio 48 49 86 33 71 65 117 39
Impact from less liquid exposures 77——
20 4 — —
Total market-based trading portfolio 55 56 101 38 91 69 115 44
Fair value option loans 35 31 40 21 33 42 55 29
Fair value option hedges 21 14 23 8 15 19 31 12
Fair value option portfolio diversification (37) (24) — — (25) (32) — —
Total fair value option portfolio 19 21 28 15 23 29 39 21
Portfolio diversification (7) (12) — — (1) (13) — —
Total market-based portfolio $ 67 $ 65 $ 120 $44
$ 113 $ 85 $ 127 $ 60
(1) The high and low for each portfolio may have occurred on different trading days than the high and low for the components. Therefore the impact from less liquid exposures and the amount of portfolio
diversification, which is the difference between the total portfolio and the sum of the individual components, are not relevant.
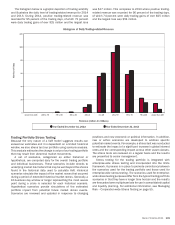
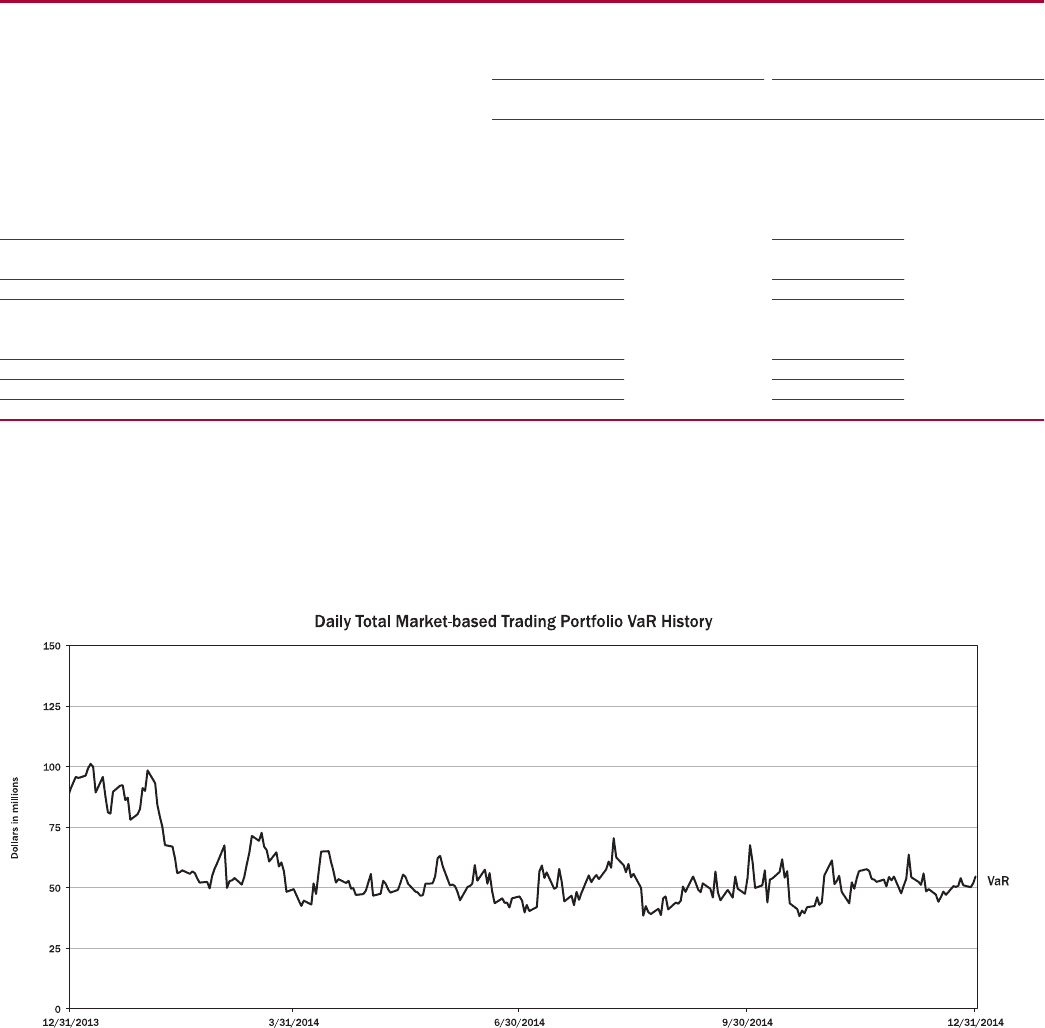
The year-end and the average total market-based trading
portfolio VaR decreased during 2014 due to elevated market
volatility experienced during the 2011 roll-out of the three-year
window of historical data used in the VaR calculation. Additionally,
a smaller impact to the reduction in total market-based trading
portfolio VaR was due to an overall reduction from portfolio
changes.
The graph below presents the daily total market-based trading
portfolio VaR for 2014, corresponding to the data in Table 61.