Bank of America 2014 Annual Report Download - page 253
Download and view the complete annual report
Please find page 253 of the 2014 Bank of America annual report below. You can navigate through the pages in the report by either clicking on the pages listed below, or by using the keyword search tool below to find specific information within the annual report.-
 1
1 -
2
-
3
-
4
-
5
-
6
-
7
-
8
-
9
-
10
-
11
-
12
-
13
-
14
-
15
-
16
-
17
-
18
-
19
-
20
-
21
-
22
-
23
-
24
-
25
-
26
-
27
-
28
-
29
-
30
-
31
-
32
-
33
-
34
-
35
-
36
-
37
-
38
-
39
-
40
-
41
-
42
-
43
-
44
-
45
-
46
-
47
-
48
-
49
-
50
-
51
-
52
-
53
-
54
-
55
-
56
-
57
-
58
-
59
-
60
-
61
-
62
-
63
-
64
-
65
-
66
-
67
-
68
-
69
-
70
-
71
-
72
-
73
-
74
-
75
-
76
-
77
-
78
-
79
-
80
-
81
-
82
-
83
-
84
-
85
-
86
-
87
-
88
-
89
-
90
-
91
-
92
-
93
-
94
-
95
-
96
-
97
-
98
-
99
-
100
-
101
-
102
-
103
-
104
-
105
-
106
-
107
-
108
-
109
-
110
-
111
-
112
-
113
-
114
-
115
-
116
-
117
-
118
-
119
-
120
-
121
-
122
-
123
-
124
-
125
-
126
-
127
-
128
-
129
-
130
-
131
-
132
-
133
-
134
-
135
-
136
-
137
-
138
-
139
-
140
-
141
-
142
-
143
-
144
-
145
-
146
-
147
-
148
-
149
-
150
-
151
-
152
-
153
-
154
-
155
-
156
-
157
-
158
-
159
-
160
-
161
-
162
-
163
-
164
-
165
-
166
-
167
-
168
-
169
-
170
-
171
-
172
-
173
-
174
-
175
-
176
-
177
-
178
-
179
-
180
-
181
-
182
-
183
-
184
-
185
-
186
-
187
-
188
-
189
-
190
-
191
-
192
-
193
-
194
-
195
-
196
-
197
-
198
-
199
-
200
-
201
-
202
-
203
-
204
-
205
-
206
-
207
-
208
-
209
-
210
-
211
-
212
-
213
-
214
-
215
-
216
-
217
-
218
-
219
-
220
-
221
-
222
-
223
-
224
-
225
-
226
-
227
-
228
-
229
-
230
-
231
-
232
-
233
-
234
-
235
-
236
-
237
-
238
-
239
-
240
-
241
-
242
-
 243
243 -
 244
244 -
 245
245 -
 246
246 -
 247
247 -
 248
248 -
 249
249 -
 250
250 -
 251
251 -
 252
252 -
 253
253 -
 254
254 -
 255
255 -
 256
256 -
 257
257 -
 258
258 -
 259
259 -
 260
260 -
 261
261 -
 262
262 -
 263
263 -
264
-
265
-
266
-
267
-
268
-
269
-
270
-
271
-
272
 |
 |
Bank of America 2014 251
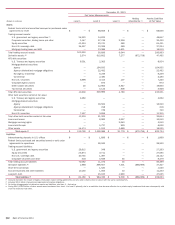
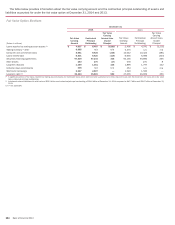
In the tables above, instruments backed by residential real
estate assets include RMBS, whole loans and mortgage CDOs.
Commercial loans, debt securities and other include corporate
CLOs and CDOs, commercial loans and bonds, and securities
backed by non-real estate assets. Structured liabilities primarily
include equity-linked notes that are accounted for under the fair
value option.
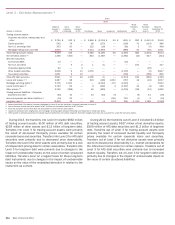
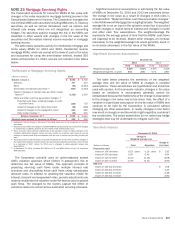
In addition to the instruments in the tables above, the
Corporation held $347 million and $767 million of instruments at
December 31, 2014 and 2013 consisting primarily of certain direct
private equity investments and private equity funds that were
classified as Level 3 and reported within other assets. Valuations
of direct private equity investments are based on the most recent
company financial information. Inputs generally include market
and acquisition comparables, entry level multiples, as well as other
variables. The Corporation selects a valuation methodology (e.g.,
market comparables) for each investment and, in certain
instances, multiple inputs are weighted to derive the most
representative value. Discounts are applied as appropriate to
consider the lack of liquidity and marketability versus publicly-
traded companies. For private equity funds, fair value is determined
using the net asset value as provided by the individual fund’s
general partner.
The Corporation uses multiple market approaches in valuing
certain of its Level 3 financial instruments. For example, market
comparables and discounted cash flows are used together. For a
given product, such as corporate debt securities, market
comparables may be used to estimate some of the unobservable
inputs and then these inputs are incorporated into a discounted
cash flow model. Therefore, the balances disclosed encompass
both of these techniques.
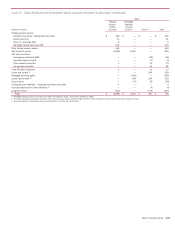
The level of aggregation and diversity within the products
disclosed in the tables result in certain ranges of inputs being
wide and unevenly distributed across asset and liability categories.
At December 31, 2014 and 2013, weighted averages are
disclosed for all loans, securities, structured liabilities and net
derivative assets.
For more information on the inputs and techniques used in the
valuation of MSRs, see Note 23 – Mortgage Servicing Rights.
Sensitivity of Fair Value Measurements to Changes in
Unobservable Inputs
Loans and Securities
For instruments backed by residential real estate assets and
commercial loans, debt securities and other, a significant increase
in market yields, default rates, loss severities or duration would
result in a significantly lower fair value for long positions. Short
positions would be impacted in a directionally opposite way. The
impact of changes in prepayment speeds would have differing
impacts depending on the seniority of the instrument and, in the
case of CLOs, whether prepayments can be reinvested.
For auction rate securities, a significant increase in price and/
or projected tender price/refinancing levels would result in a
significantly higher fair value.
Structured Liabilities and Derivatives
For credit derivatives, a significant increase in market yield,
including spreads to indices, upfront points (i.e., a single upfront
payment made by a protection buyer at inception), default rates
or loss severities would result in a significantly lower fair value for
protection sellers and higher fair value for protection buyers. The
impact of changes in prepayment speeds would have differing
impacts depending on the seniority of the instrument and, in the
case of CLOs, whether prepayments can be reinvested.
Structured credit derivatives, which include tranched portfolio
CDS and derivatives with derivative product company (DPC) and
monoline counterparties, are impacted by credit correlation,
including default and wrong-way correlation. Default correlation is
a parameter that describes the degree of dependence among
credit default rates within a credit portfolio that underlies a credit
derivative instrument. The sensitivity of this input on the fair value
varies depending on the level of subordination of the tranche. For
senior tranches that are net purchases of protection, a significant
increase in default correlation would result in a significantly higher
fair value. Net short protection positions would be impacted in a
directionally opposite way. Wrong-way correlation is a parameter
that describes the probability that as exposure to a counterparty
increases, the credit quality of the counterparty decreases. A
significantly higher degree of wrong-way correlation between a DPC
counterparty and underlying derivative exposure would result in a
significantly lower fair value.
For equity derivatives, interest rate derivatives and structured
liabilities, a significant change in long-dated rates and volatilities
and correlation inputs (e.g., the degree of correlation between an
equity security and an index, between two different interest rates,
or between interest rates and foreign exchange rates) would result
in a significant impact to the fair value; however, the magnitude
and direction of the impact depends on whether the Corporation
is long or short the exposure.