Bank of America 2014 Annual Report Download - page 235
Download and view the complete annual report
Please find page 235 of the 2014 Bank of America annual report below. You can navigate through the pages in the report by either clicking on the pages listed below, or by using the keyword search tool below to find specific information within the annual report.-
 1
1 -
2
-
3
-
4
-
5
-
6
-
7
-
8
-
9
-
10
-
11
-
12
-
13
-
14
-
15
-
16
-
17
-
18
-
19
-
20
-
21
-
22
-
23
-
24
-
25
-
26
-
27
-
28
-
29
-
30
-
31
-
32
-
33
-
34
-
35
-
36
-
37
-
38
-
39
-
40
-
41
-
42
-
43
-
44
-
45
-
46
-
47
-
48
-
49
-
50
-
51
-
52
-
53
-
54
-
55
-
56
-
57
-
58
-
59
-
60
-
61
-
62
-
63
-
64
-
65
-
66
-
67
-
68
-
69
-
70
-
71
-
72
-
73
-
74
-
75
-
76
-
77
-
78
-
79
-
80
-
81
-
82
-
83
-
84
-
85
-
86
-
87
-
88
-
89
-
90
-
91
-
92
-
93
-
94
-
95
-
96
-
97
-
98
-
99
-
100
-
101
-
102
-
103
-
104
-
105
-
106
-
107
-
108
-
109
-
110
-
111
-
112
-
113
-
114
-
115
-
116
-
117
-
118
-
119
-
120
-
121
-
122
-
123
-
124
-
125
-
126
-
127
-
128
-
129
-
130
-
131
-
132
-
133
-
134
-
135
-
136
-
137
-
138
-
139
-
140
-
141
-
142
-
143
-
144
-
145
-
146
-
147
-
148
-
149
-
150
-
151
-
152
-
153
-
154
-
155
-
156
-
157
-
158
-
159
-
160
-
161
-
162
-
163
-
164
-
165
-
166
-
167
-
168
-
169
-
170
-
171
-
172
-
173
-
174
-
175
-
176
-
177
-
178
-
179
-
180
-
181
-
182
-
183
-
184
-
185
-
186
-
187
-
188
-
189
-
190
-
191
-
192
-
193
-
194
-
195
-
196
-
197
-
198
-
199
-
200
-
201
-
202
-
203
-
204
-
205
-
206
-
207
-
208
-
209
-
210
-
211
-
212
-
213
-
214
-
215
-
216
-
217
-
218
-
219
-
220
-
221
-
222
-
223
-
224
-
 225
225 -
 226
226 -
 227
227 -
 228
228 -
 229
229 -
 230
230 -
 231
231 -
 232
232 -
 233
233 -
 234
234 -
 235
235 -
 236
236 -
 237
237 -
 238
238 -
 239
239 -
 240
240 -
 241
241 -
 242
242 -
 243
243 -
 244
244 -
 245
245 -
246
-
247
-
248
-
249
-
250
-
251
-
252
-
253
-
254
-
255
-
256
-
257
-
258
-
259
-
260
-
261
-
262
-
263
-
264
-
265
-
266
-
267
-
268
-
269
-
270
-
271
-
272
 |
 |

Bank of America 2014 233
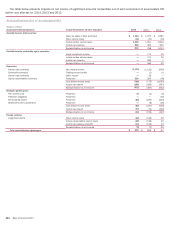
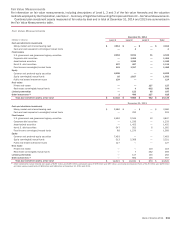
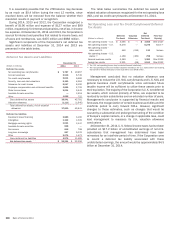
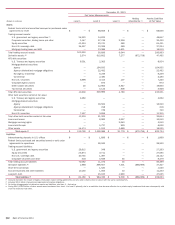
Fair Value Measurements
For information on fair value measurements, including descriptions of Level 1, 2 and 3 of the fair value hierarchy and the valuation
methods employed by the Corporation, see Note 1 – Summary of Significant Accounting Principles and Note 20 – Fair Value Measurements.
Combined plan investment assets measured at fair value by level and in total at December 31, 2014 and 2013 are summarized in
the Fair Value Measurements table.
Fair Value Measurements
December 31, 2014
(Dollars in millions) Level 1 Level 2 Level 3 Total
Cash and short-term investments
Money market and interest-bearing cash $ 3,814 $ — $ —$ 3,814
Cash and cash equivalent commingled/mutual funds —4
—4
Fixed income
U.S. government and government agency securities 2,004 2,151 11 4,166
Corporate debt securities — 1,454 —1,454
Asset-backed securities — 1,930 —1,930
Non-U.S. debt securities 627 487 — 1,114
Fixed income commingled/mutual funds 101 1,397 —1,498
Equity
Common and preferred equity securities 6,628 — —6,628
Equity commingled/mutual funds 16 1,817 —1,833
Public real estate investment trusts 124 ——124
Real estate
Private real estate ——
127 127
Real estate commingled/mutual funds —4
632 636
Limited partnerships — 122 65 187
Other investments (1) 1490 127 618
Total plan investment assets, at fair value $ 13,315 $ 9,856 $ 962 $ 24,133
December 31, 2013
Cash and short-term investments
Money market and interest-bearing cash $ 2,586 $ — $ — $ 2,586
Cash and cash equivalent commingled/mutual funds — 223 — 223
Fixed income
U.S. government and government agency securities 1,590 2,245 12 3,847
Corporate debt securities — 1,233 — 1,233
Asset-backed securities — 1,455 — 1,455
Non-U.S. debt securities 547 502 6 1,055
Fixed income commingled/mutual funds 89 1,279 — 1,368
Equity
Common and preferred equity securities 7,463 — — 7,463
Equity commingled/mutual funds 213 2,308 — 2,521
Public real estate investment trusts 127 — — 127
Real estate
Private real estate — — 119 119
Real estate commingled/mutual funds — 7 462 469
Limited partnerships — 117 145 262
Other investments (1) — 662 135 797
Total plan investment assets, at fair value $ 12,615 $ 10,031 $ 879 $ 23,525
(1) Other investments include interest rate swaps of $297 million and $435 million, participant loans of $78 million and $87 million, commodity and balanced funds of $178 million and $229 million
and other various investments of $65 million and $46 million at December 31, 2014 and 2013.